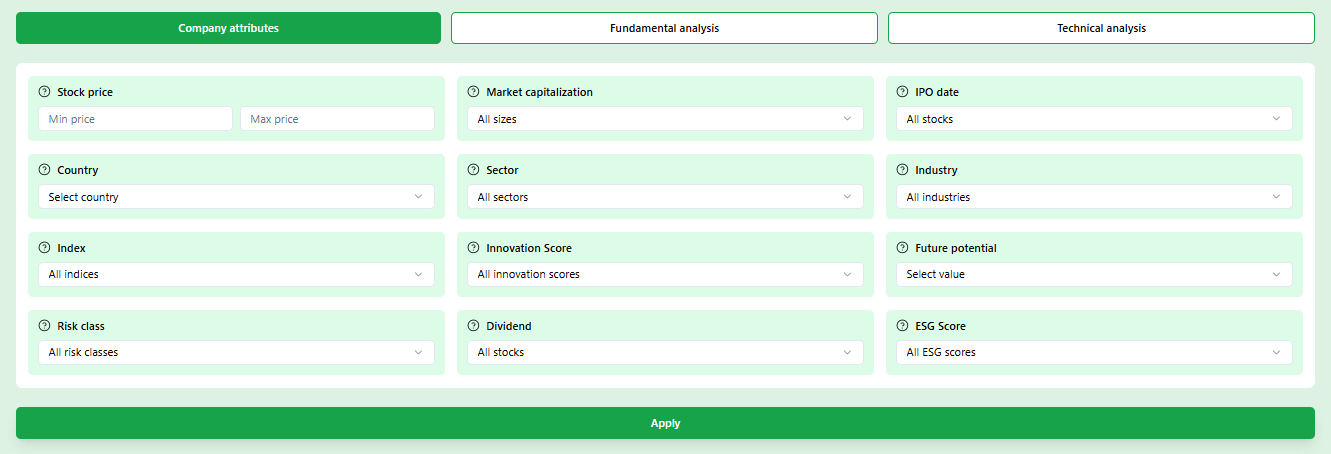
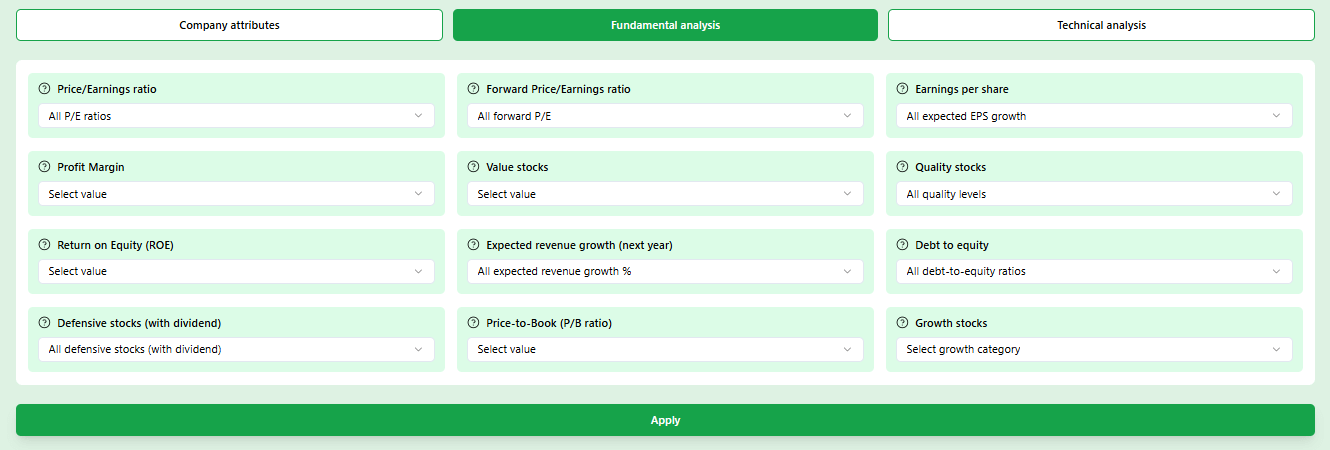
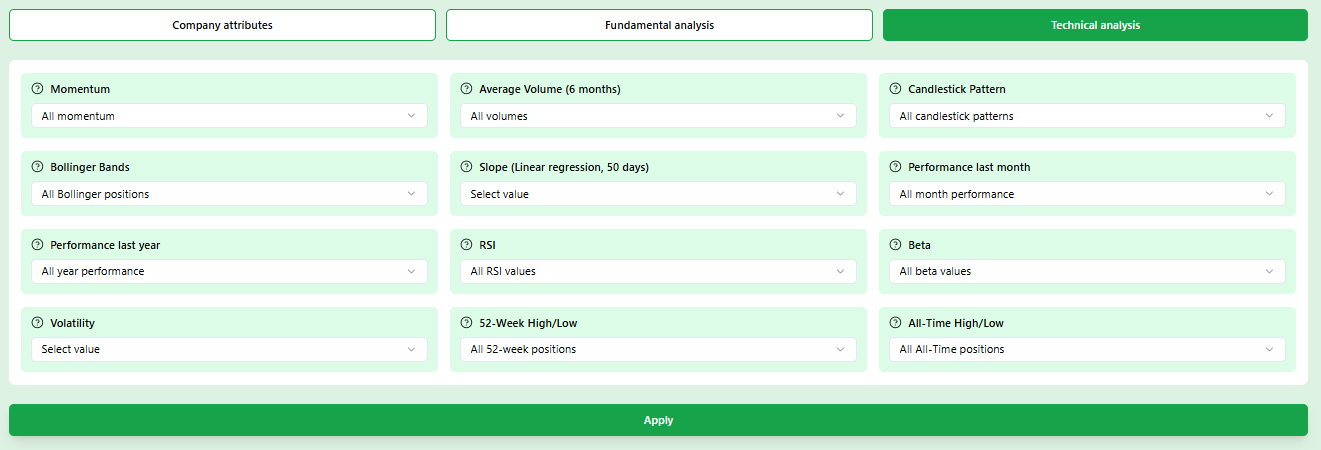
Small cap stocks can offer growth potential, but they also require careful selection. A small cap screener helps you filter companies by market capitalization, revenue growth, debt levels, and technical indicators so you can focus on a smaller group of stocks for further analysis.
✓ No credit card required · ✓ Instant access · ✓ Free filters included
Set your filters and find small cap stocks now
Pre-loaded with the market cap range for true small caps. Add revenue growth or a debt ceiling and the list narrows to companies worth a closer look.
Three filters that do most of the work
You do not need thirty filters to build a useful small cap shortlist. Market cap range defines the universe. Revenue growth separates expanding businesses from stagnant ones. Debt to equity removes fragile balance sheets before you read a single annual report. Start there and add sector or country if you want to narrow further.
Market cap: $300M to $2B
True small cap territory. Below $300M the liquidity gets thin; above $2B the institutional ownership grows thick enough to reduce the information edge you have as an individual investor.
Revenue growth above 10%
Small companies at this size can still move the needle with a single product cycle. A growing top line at 10% or more in a small cap says the business has product-market fit and customers are expanding their spend.
Debt to equity below 1.0
Leverage amplifies both gains and losses, but in a small cap it can be existential. A debt-to-equity ceiling filters out companies that might survive a calm market but struggle the moment credit conditions tighten.
What separates a small cap screener from a general filter tool
Small cap investing has a different risk and return profile. The filters that matter reflect that difference.
Market cap range, not just a label
Setting $300M to $2B is very different from checking a box that says 'small cap'. The range gives you control over the liquidity floor and the institutional ownership ceiling. Companies right at the bottom of the range trade with far less daily volume than those at the top, which affects how you size a position.
Revenue growth: the momentum signal
In large caps, a 5% revenue growth rate can be impressive. In small caps it is table stakes. The screener lets you set a growth floor so you only see companies where the top line is moving in the right direction. Flat or shrinking revenue in a small cap is a warning sign that scale is not happening.
Debt: the survival filter
A debt-heavy small cap with no recurring revenue can go from a concerning position to a distressed situation in a single bad quarter. Filtering on debt-to-equity or interest coverage removes companies where the capital structure is the main risk, so you can focus on businesses where the competitive story is the thing to evaluate.
Volume: daily tradability
Daily dollar volume determines how much of a position you can take and exit without moving the price. A stock with $100,000 daily volume is effectively uninvestable for anyone putting more than a few thousand to work. Setting a volume floor keeps the results in territory where your order does not become the market.
Sector and country: research context
A software small cap and a mining small cap require completely different research frameworks. The sector filter keeps results in areas where you understand what drives the valuation. The country filter ensures you are looking at companies under a regulatory environment you can interpret without needing a specialist.
RSI and 52-week position: timing
After the fundamentals narrow your list, technical position helps you prioritise which stocks to look at first. A fundamentally solid small cap sitting near its 52-week low with an RSI below 40 is telling you that selling pressure may be exhausting itself. That is a much better starting point than a stock already up 60% from its low.
How to read each filter: ranges and what they mean
Each filter has a zone where the signal is useful, a zone where it needs context, and a zone that is usually a warning. Here is how to interpret the six most important ones.
Market Capitalisation
The green zone ($300M to $2B) gives you the best balance between liquidity and information asymmetry. Below $300M, daily volume becomes a real constraint. Above $2B, institutional coverage closes most of the pricing gaps you would otherwise exploit.
Revenue Growth (Year over Year)
Revenue shrinking
0 to 5% growth
5 to 10% growth
A small cap growing revenue above 10% annually is demonstrating that its market is expanding or that it is taking share. Below 5%, the growth premium that small caps command is not justified by the actual business trajectory.
Debt / Equity Ratio
A debt-to-equity ratio above 1.5 in a small cap without recurring revenue is a structural red flag. It means the company owes more than 1.5 times what shareholders own, and in a tight credit environment it may need to raise equity — which dilutes you. Set the ceiling at 1.0 to stay comfortably inside the safer zone.
RSI (Relative Strength Index)
For small cap stocks with solid fundamentals, an RSI between 30 and 50 often signals that recent selling pressure has pushed the price below fair value. This is a useful shortlist priority signal — not a standalone buy signal. An RSI below 30 can indicate genuine business distress, not just overselling, so always check the fundamentals first.
P/E Ratio (Price / Earnings)
Below 10 — check why
A low P/E in a small cap deserves investigation before celebration. It can mean the market is pricing in declining earnings — or it can mean the market has not yet noticed the company. Combine a P/E ceiling of 20 with a revenue growth floor of 10% to find the second category rather than the first.
Daily Trading Volume
Below $100K daily
$100K to $500K daily
Above $500K daily
Volume determines how large a position you can take without becoming the market. If a stock averages $200K in daily volume and you want to invest $20,000, you are 10% of the day's trading before you place your order. In a falling market, that concentration makes exiting costly. Set a volume floor of at least $500K to stay in freely tradeable territory.
How to use a small cap stock screener effectively
Knowing what filters exist is one thing. Knowing how to sequence them and what the output tells you is where the real advantage is.
Define your market cap range before anything else
The first filter you set in any small cap screener should be the market capitalisation range, not the sector, not the P/E ratio, not the country. The reason is simple: the market cap determines everything else about how the stock behaves. A company with a $350M market cap has almost no institutional analyst coverage, trades with limited liquidity and is usually driven by a small number of insiders and retail investors. That is a completely different environment from a $1.8B company that has started to attract small fund allocations.
Setting the floor at $300M eliminates the truly illiquid micro caps. Setting the ceiling at $2B keeps you in a space where the information asymmetry between you and the market is still meaningful. Companies in that corridor are often too small for most ETFs and too small for the larger funds to take a meaningful position, which is precisely what creates the opportunity.
Add revenue growth to separate expanding businesses from flat ones
Once the market cap range is set, revenue growth becomes the most diagnostic filter for a small cap screener. A company growing its top line at 12% annually while sitting in the small cap range is typically either in an expanding market, gaining market share from larger competitors, or successfully launching a new product. Any of those three drivers is worth investigating.
Companies with flat or declining revenue in the small cap space face a structural problem: they are too small to absorb a bad quarter through sheer size, and they lack the brand equity that lets a large cap navigate a rough patch without losing customers. Setting a revenue growth floor of 8 to 10% filters out most of those situations without being so demanding that you eliminate legitimate turnaround candidates.
Reading the balance sheet in the small cap universe
Balance sheet quality matters in every size company, but it is existential in small caps. A large company can often restructure debt, raise equity at a modest dilution, or sell assets to survive a crisis. A small cap with poor balance sheet health has far fewer options. The debt-to-equity ratio gives you a quick view of how much the company is relying on borrowed money. Anything above 1.5 in a small cap without strong, predictable cash flow deserves additional scrutiny before it makes your shortlist.
Beyond debt ratio, look at cash relative to quarterly burn for pre-profitability companies. A small cap with 18 months of cash at current spending rates has enough runway to reach a meaningful milestone. One with 6 months of cash is effectively already fundraising, and the next share issuance will dilute your position. The screener surfaces these signals so you can exclude the most dangerous situations before you spend time reading the annual report.
Why technical signals work differently in small caps
Technical analysis in large caps is partly a self-fulfilling exercise: millions of traders watch the same indicators and react to the same levels, which makes those levels meaningful. In small caps, the dynamics are different. Thin liquidity means a single large seller can push RSI to extreme oversold levels without any fundamental deterioration in the business. That creates moments where the technical picture looks worse than the underlying reality.
The most useful technical filter in a small cap screener is the 52-week position. A company trading at 30 to 50% of its 52-week high, with fundamentals that have not deteriorated, often signals that a sentiment-driven selloff has overshot the fair value. Adding an RSI floor below 45 alongside that 52-week position filter tends to produce a shortlist of companies where the price story and the fundamental story are genuinely diverging — which is exactly the setup worth researching.
Building a repeatable small cap research workflow
The screener produces a shortlist, not a buy list. The companies in your filtered results are candidates for further research, not automatic purchases. A repeatable workflow looks like this: the screener narrows thousands of small caps to a focused group based on your criteria, you read the most recent investor presentation and annual report for each candidate, you check whether the growth numbers are driven by a sustainable business model or a one-time event, and then you decide whether the current price makes sense given what you learned.
The advantage of starting from a screener is that every company on your research list has already passed a set of quantitative gates. You are not reading about companies that have declining revenue or unsustainable debt loads — those are already gone. What remains is a group where the fundamental story is worth understanding, and your time goes toward evaluating the competitive position and management quality rather than checking whether the basics hold up.
Not sure which filters to use? Answer three questions instead
The Smart Filter translates your investment preferences into screener criteria automatically. You answer questions about your time horizon, what you are looking for in a company and how much volatility you can accept, and the tool builds the filter combination that matches those answers.
Takes about two minutes
Three questions is enough to define a meaningful filter set. You are not filling out a form — you are choosing between clear options that the screener maps to actual criteria.
Results tailored to your style
An investor looking for undervalued small caps with low debt gets a different filter set than one looking for high-growth momentum plays. The output reflects your answers, not a generic template.
Save and adjust anytime
Once your initial results appear, every filter is visible and editable. You can keep the question-based setup as a starting point and manually adjust any parameter to see how the list changes.
Start your small cap search today
Create a free account and run your first filtered search in under two minutes. No credit card required, no preset list — just the filters you choose and the results they produce.
✓ No credit card required · ✓ Instant access · ✓ Free basic features
Built for the small cap investor
The screener is designed around how small cap research actually works, not how large cap analysis is usually taught.
Market cap first
Growth-weighted results
Balance sheet visible upfront
Both filter modes available
About Belegget
Belegget was built on the idea that individual investors deserve access to the same type of filtering and research tools that institutional teams use, without needing a Bloomberg terminal or a team of analysts. The small cap screener is designed to make structured research practical for investors who manage their own portfolio alongside a regular job.
Frequently asked questions
Everything worth knowing before you run your first small cap screen
More screener tools worth exploring
Small cap is one segment of the market. These screeners cover different strategies and filter sets that work alongside or independently of a market-cap focus.
Growth Stock Screener
Filter specifically for revenue acceleration, earnings momentum and high-growth sectors. Complements a small cap screen when you want to prioritise pace of expansion over valuation.
Custom Stock Screener
Build your own filter combination from scratch. Choose any combination of fundamental, technical and market cap criteria without a predefined starting point.
Simple Stock Screener
If you are new to screening and want to start with a straightforward setup before adding complexity, this is where to begin. Fewer filters, clearer output.