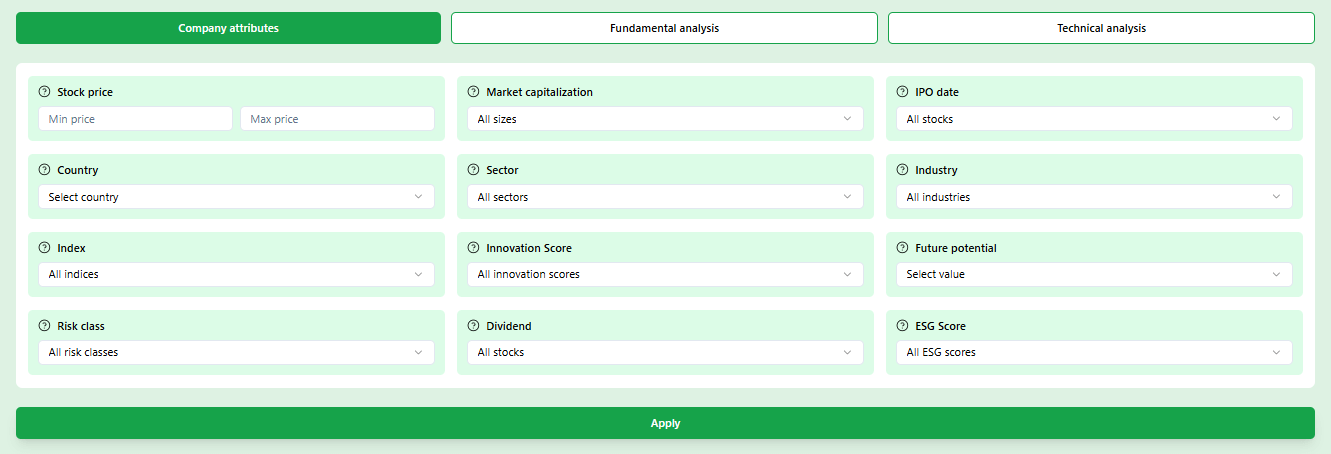
Revenue growth filter with sector context
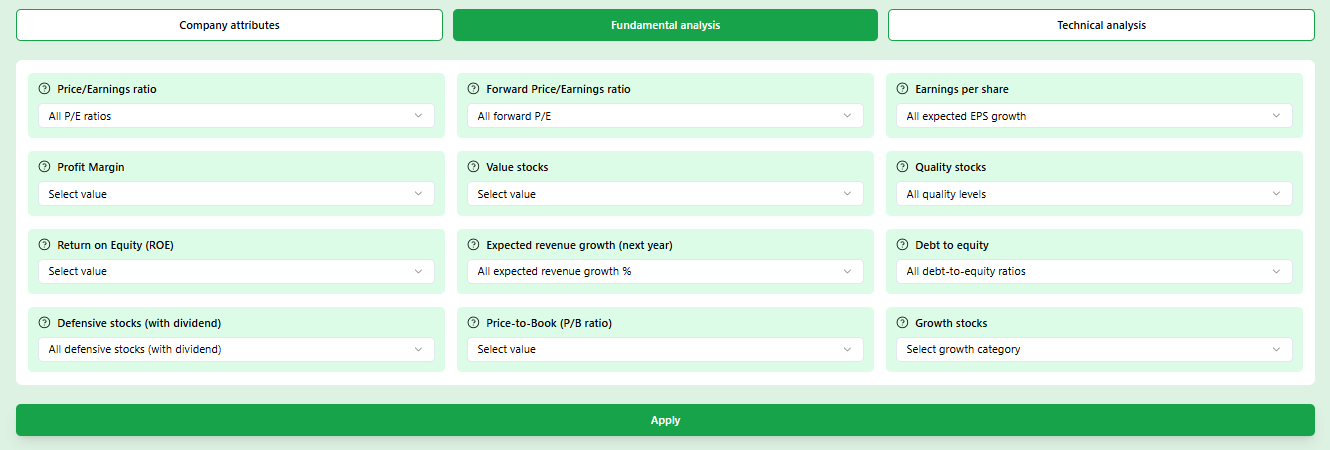
EPS growth that confirms the revenue story
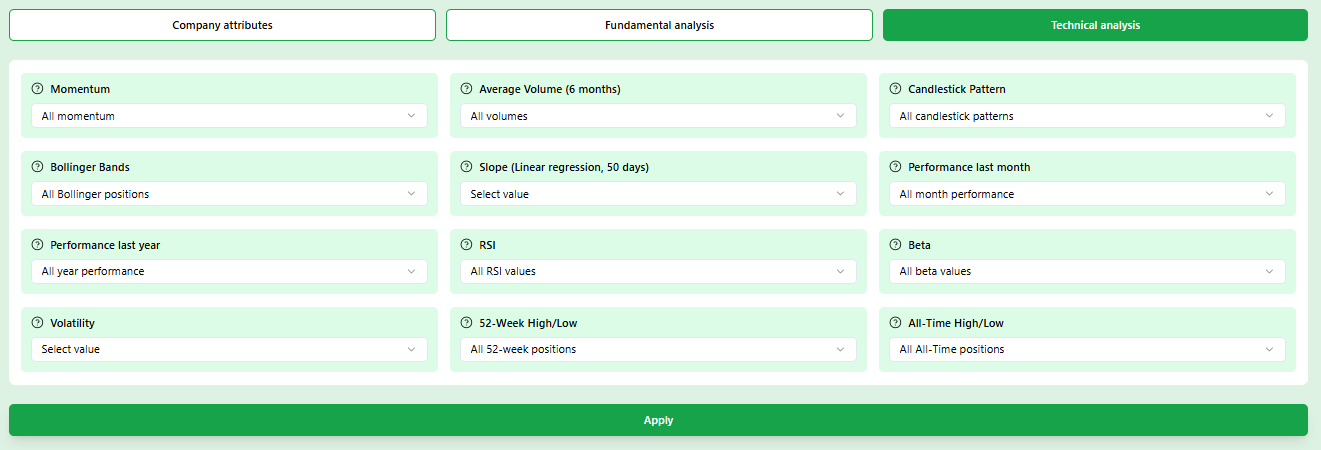
Forward P/E to gauge what growth costs you
25,000 stocks across 52 countries
The growth stock screener filters 25,000 companies by revenue growth rate, EPS acceleration, forward P/E and momentum. Set your criteria and get a focused shortlist within seconds.
Try the growth stock screener right now
All filters visible at once. Adjust any combination and see matching growth stocks appear instantly.
What do the growth numbers actually mean?
A quick reference for every key metric in the screener — what strong, acceptable and weak looks like per filter so you know exactly what you are selecting
These ranges are general starting points. Always compare within the same sector and growth stage context.
Answer a few questions and the growth stock screener does the rest
Tell the Smart Filter what growth stage, sector and holding period fits your strategy. It maps your answers to the right combination of filters and surfaces the companies that fit instantly.
Growth stage selection
Early scaling, profitable growth or established compounder — you decide
Sector and geography
Tech, healthcare, clean energy or global view across 52 countries
Holding period and risk tolerance
Short-term momentum or multi-year compounding thesis covered
Filters built specifically for growth stock analysis
Revenue growth, EPS acceleration, innovation score and forward earnings estimates together in one place. No switching between data sources to build the picture.
Revenue growth rate by tier
From limited growth to explosive growth above 25 percent
EPS growth and acceleration
Year over year earnings per share expansion filtered by strength
Sector and market cap combination
Focus on the size and industry where growth makes the most sense
Four things that make this growth stock screener different
Built around the metrics that actually separate high-growth companies from the rest of the market
How to use a growth stock screener effectively
Understanding each filter and what it actually measures makes the difference between a productive shortlist and a list of expensive names you do not understand
Ready to find your next growth stock?
Start with a free account and run your first growth stock screen today. No credit card required.
Frequently asked questions about the growth stock screener
Answers to the questions most growth investors ask before they start screening
About Belegget
Belegget was built on the idea that finding good stocks should not require a Bloomberg terminal or hours of manual research. The growth stock screener is one piece of a broader platform that covers the full investing workflow from initial screening to portfolio tracking and monitoring.
Start your first growth stock screen today
Free account. No credit card. Access the growth stock screener and see which companies are actually growing right now.
Other screeners worth exploring
Growth investing is one approach. These guides cover screeners built for different strategies and stock types.
Penny Stock Screener
Find small-priced stocks with high-volume signals and filter out illiquid names that look cheap for the wrong reasons.
Stock Volatility Screener
Screen for stocks by their daily and historical volatility range, useful whether you want stability or active price movement.
Mobile Stock Screener
Run your full screener setup from a smartphone. The same filters, results and watchlist available anywhere you go.
Frequently Asked Questions
- What is a growth stock screener and what makes it different from a general screener?
- A growth stock screener is a filter tool built specifically around the metrics that matter for companies expanding faster than the broader market. Where a general screener might show you dividend yield, book value and price to earnings simultaneously, a growth stock screener prioritises revenue growth rate, EPS acceleration, forward earnings estimates and price to earnings growth. The filters are calibrated for the reality that growth companies are often priced at high multiples, not because investors are irrational, but because the market is already pricing in future expansion. This screener helps you evaluate whether that premium is justified.
- What revenue growth rate should I filter for when looking for growth stocks?
- This depends heavily on the sector. In software and technology, companies growing revenue below 15 percent per year are generally not considered high-growth. In healthcare equipment, 8 to 12 percent annual revenue growth can represent a genuinely high-performing business. The growth stock screener lets you combine revenue growth with sector filters precisely because there is no universal threshold that makes sense across industries. For most growth investors targeting mid-cap technology and healthcare names, filtering for 15 to 30 percent revenue growth is a productive starting point.
- What is the difference between revenue growth and EPS growth in the context of screening?
- Revenue growth tells you how fast the top line is expanding. EPS growth tells you whether that expansion is translating into increasing profit per share. Many early-stage growth companies show strong revenue growth while EPS is negative or declining because they are reinvesting aggressively. Neither is automatically good or bad. High revenue growth with negative EPS can be completely appropriate for a business in land-grab mode where the unit economics are strong. High revenue growth with deteriorating EPS in a more mature business is a warning sign. The screener lets you combine both filters to match your specific view.
- Is a high P/E ratio automatically bad for a growth stock?
- Not necessarily. A P/E ratio of 50 is expensive for a company growing earnings at 5 percent per year. The same P/E of 50 is arguably reasonable for a company growing earnings at 40 percent per year, because at that growth rate, the earnings base catches up to the valuation multiple within a few years. The meaningful number is the PEG ratio, which divides the P/E by the growth rate. The growth stock screener lets you filter on forward P/E and combine it with EPS growth so you can make that comparison yourself rather than dismissing high-multiple stocks purely on the P/E number.
- How do I use the slope filter to find growth stocks with momentum?
- The slope filter measures the direction of price movement using linear regression over 50 trading days. A strong uptrend reading means the price has been rising consistently, not just in one volatile session. For growth investors, combining a strong uptrend with high revenue growth acts as a confirmation signal: the fundamentals are good and the market is recognising them. The slope filter is a useful way to avoid buying growth stocks that are fundamentally interesting but still in a prolonged downtrend, which can tie up capital for much longer than expected.
- Can I screen for growth stocks outside the United States?
- Yes. The screener covers stocks across 52 countries including major European markets, India, Australia and Asian exchanges. Many of the fastest-growing companies right now are not in the US. Indian technology and financial services companies, Scandinavian software businesses, and several Latin American consumer platforms are growing at rates that put many US large-caps to shame. The country and region filters let you explore these markets specifically or combine them with fundamental growth filters to find the best performers globally.
- What is the Growth Stocks filter and how does it differ from filtering on revenue growth manually?
- The Growth Stocks filter is a composite scoring system that classifies companies into growth tiers from limited growth up to explosive growth above 25 percent per year. The advantage over filtering on raw revenue growth manually is that the composite accounts for consistency: a company that grew revenue 30 percent two years ago and then 5 percent last year scores differently than one that has been growing 20 percent per year consistently for three years. Consistency of growth is often more predictive than a single high reading.
- Should I focus on large-cap or small-cap growth stocks?
- Both categories have distinct risk and return profiles worth understanding before you decide. Large-cap growth stocks have more analyst coverage, higher liquidity and more predictable earnings, but their growth rates are naturally lower because a larger revenue base is harder to grow at the same percentage rate. Small and mid-cap growth stocks can deliver higher percentage gains because they are growing from a smaller base, but they carry more volatility, less liquidity and greater sensitivity to earnings misses. Most growth investors hold a mix, using the market cap filter to manage concentration.
- How often does the data in the growth stock screener update?
- Stock prices and momentum metrics update continuously during market hours. Fundamental data including revenue growth rates and EPS figures update when companies publish quarterly results. The forward P/E and analyst consensus growth figures update when analysts revise their estimates, typically after earnings calls or major news events. You are working with current information rather than annual report data from six months ago.
- Can I try the growth stock screener for free?
- Yes. The basic filter set including sector, country, market cap, P/E ratio, EPS growth and technical momentum filters is available on a free account. Premium filters like the Growth Stocks composite score, Expected Revenue Growth, Forward P/E and the Smart Filter questionnaire require a subscription. Many investors find the free combination of sector plus EPS growth plus momentum already generates a focused shortlist before deciding whether the additional premium filters add enough value.