Define your investment profile
Before looking at any stock, clarify what kind of investor you are. Time horizon, risk tolerance, income vs growth, sector preferences. This takes 10 minutes and saves you from chasing stocks that simply do not match your situation.
Set your screening criteria
Use quantitative filters to narrow 10,000 stocks down to a manageable shortlist. P/E ratio, market cap, sector, ROE, revenue growth. Each filter you add removes companies that are wrong for you, without requiring you to analyze them manually.
Evaluate the shortlist in depth
For each candidate, read the last two years of earnings results, check the cash flow statement, and assess the competitive position. Look for a reason the market may have mispriced the stock, upward or downward.
Time your entry with technical context
Once you have conviction on a company, use technical signals to improve your entry point. Avoid buying at obvious short term peaks. Add the stock to your watchlist and wait for a setup that gives you a margin of safety.
Finding good stocks can feel overwhelming when you face endless news, charts, and financial data with no clear starting point. This guide shows you which metrics actually matter, how to use a stock screener to cut through the noise, and what separates companies worth researching from those you can skip entirely.
✓ Immediate access · ✓ No credit card required
What actually separates a quality stock from the rest
The difference is not always visible in the price. It shows up in the fundamentals.
Positive and growing year over year
Consistently above 15%
Stable or expanding, not contracting
Manageable relative to operating earnings
Driven by volume or pricing power, not accounting
Capital allocation history you can actually trust
Buying growth at the cost of profitability
Refinancing risk is often underestimated
Reported profits that never turn into cash
Management knows more than the market
Acquisitions that cannot be unwound cleanly
Cost cutting that runs out of road
Not sure where to start? Answer a few questions and get a curated shortlist
The Smart Filter works differently from a traditional screener. Instead of asking you to enter P/E ratios and ROE thresholds upfront, it asks about your investment goals and translates those into the right criteria automatically. You tell it your time horizon, the type of company you prefer, and the growth phase you are looking for. It handles the rest.
No financial knowledge required
The filter translates your preferences into quantitative criteria behind the scenes
Results that match your strategy
Not a generic top 10 list, but a selection built around your specific profile
Saves two to three hours of research time
The shortlist you get after three questions would take a spreadsheet model hours to produce
Build your own filter and let the screener do the scanning
Once you know what you are looking for, the manual screener lets you combine up to 36 filters across fundamental, technical and structural categories. Set a P/E range, a minimum ROE, a revenue growth floor, a geographic market and a sector. The screener applies all conditions simultaneously and shows only stocks where every criterion is met.
Fundamental filters
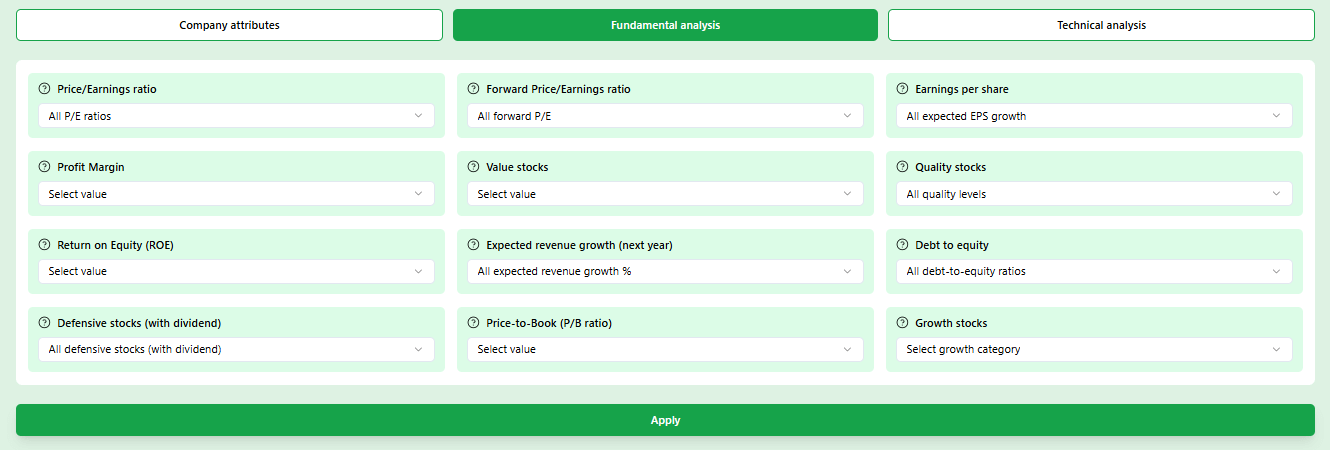
P/E, P/B, ROE, net margin, revenue growth, free cash flow yield
Technical filters
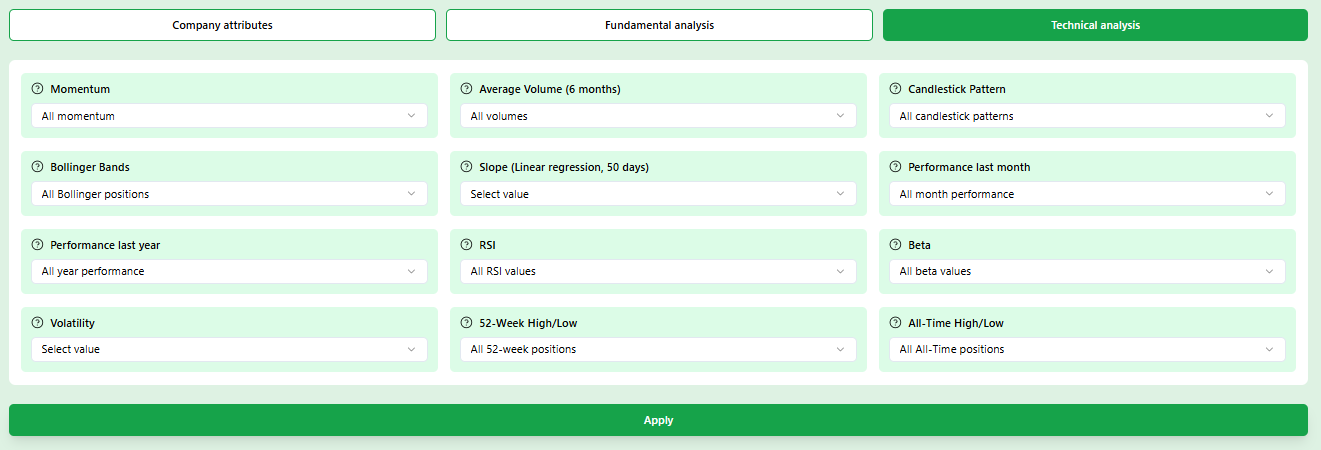
RSI, 52-week position, Bollinger Bands, momentum signals
Structural filters
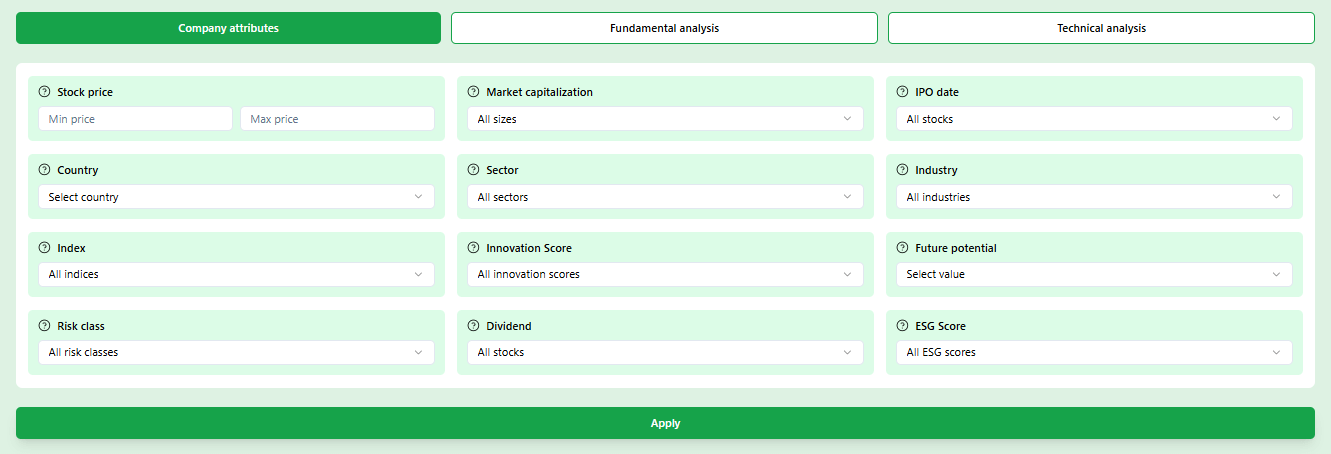
Sector, country, market cap, dividend yield, index membership
The four-step process most successful investors follow
The question of how do I find good stocks has a practical answer: follow a repeatable process rather than reacting to news. Here is what that looks like in four steps.
Start building your shortlist today
Create a free account, set your first filter combination, and see which stocks match your criteria right now.
✓ No credit card required · ✓ Instant access · ✓ Free basic features
Five things that good stock research actually looks like
Each of these areas rewards careful attention. Skip one and you will miss something important.
Let your strategy speak first, before you look at any chart
The biggest source of poor investment decisions is not bad analysis. It is analyzing the wrong companies to begin with. If you are a long term investor looking for compounding quality businesses and you spend your time evaluating volatile small caps that need to be monitored daily, the mismatch will cost you.
The Smart Filter starts with your investment profile: how long you want to hold, what return source you prefer (capital appreciation or income), and which company phase appeals to you. It then maps those preferences onto quantitative criteria. This means your screener results start from the right place, not from a generic list of popular tickers.
Revenue, margins and cash flow: reading what the numbers actually say
Revenue growth is the most reported number and the most misread one. A company growing revenue by 30% sounds compelling, but if the gross margin dropped from 60% to 45% in the same period, something is wrong. Either pricing power is eroding, input costs are rising faster than the business can absorb, or the growth is coming from low margin segments that dilute the overall quality of the business.
The combination worth tracking is revenue growth alongside gross margin stability and free cash flow conversion. Free cash flow is what remains after the company has paid for growth. If earnings are growing but free cash flow is flat or declining, the reported profits are not generating real economic value. When investors ask how do I find good stocks with genuine earnings quality, this three-way combination is exactly what to screen for: our fundamental filters let you apply all three thresholds at once, so only companies that meet every criterion appear in your results.
Why sector and region selection shape your results more than you expect
A strong industry tailwind lifts average companies. A structural headwind drags down excellent ones. This is not a new observation, but investors consistently underestimate how much of a stock's performance over a three to five year period is explained by the sector and region it operates in, rather than company-specific factors.
Screening by sector and geography first narrows the field to companies that are at least operating in favorable conditions. From there, the fundamental filters separate the best positioned companies within that group from the rest. Combining sector tailwind with strong individual fundamentals is the setup that historically produces the most consistent results. The screener makes this combination easy to apply without any spreadsheet work.
Good stocks exist everywhere. Buying them at a reasonable moment is a separate skill
Investors who buy fundamentally strong companies at obvious short term peaks still underperform. The entry price determines your initial return cushion, and a poor entry means you spend the first year recovering rather than compounding.
Technical filters are most useful here as a second layer of assessment, not a replacement for fundamental work. Once you have identified a quality company, check where it sits in its 52-week range, whether the RSI suggests near term exhaustion, and whether momentum is accelerating or fading. None of these signals is definitive on its own, but together they help you avoid the mistake of buying a great company at exactly the wrong moment. The screener combines both layers so you can run a single query that addresses both fundamentals and timing.
Most gains come to investors who prepared their list before the opportunity arrived
The investors who bought quality companies at the lows of 2020, 2022, or during any other broad correction were not lucky. They had a watchlist of companies they understood and had already decided they wanted to own at the right price. When the price dropped to that level, they acted. Everyone else was reading headlines trying to decide whether the moment was right.
The watchlist and favorites feature in Belegget is designed for exactly this use: you track the companies from your screener results over time, monitor for earnings surprises or price movements that create entry points, and stay informed without having to repeat your research from scratch. The preparation happens before the opportunity. The action is fast when it comes.
Put the framework into practice
Create a free account and run your first screener query today. Your shortlist takes minutes to build.
Built for investors who want clarity, not noise
Belegget strips away everything that does not help you make a better decision
Quality filters
Real fundamentals
Any market
Your definition
About Belegget
Belegget was built around one observation: finding quality stocks should not require a Bloomberg terminal or a finance degree. The tools that professional investors use to identify strong companies have been simplified into a screener that any investor can use from day one.
No inflated feature lists, no data overload. Just the filters and information that actually change investment decisions, presented in a way that is clear and direct.
Questions investors actually ask
Specific answers to the questions that matter when you are doing real research
More stock screening guides worth reading
Each of these guides covers a specific screening approach that pairs well with the fundamentals framework above.
Easy to Use Stock Screener
A screener that does not require hours of setup. Start filtering in minutes with a clean, intuitive interface designed for all experience levels.
Undervalued Stock Screener
How to screen for companies trading below their intrinsic value. Combines P/E, P/B and free cash flow yield to surface genuinely discounted opportunities.
Smart Money Stock Screener
Screen for the signals that institutional investors track. Identifies companies where fundamentals and ownership patterns align toward upside.