Deep Analysis
25,000+ Stocks
Side by Side Comparison
Updated Daily
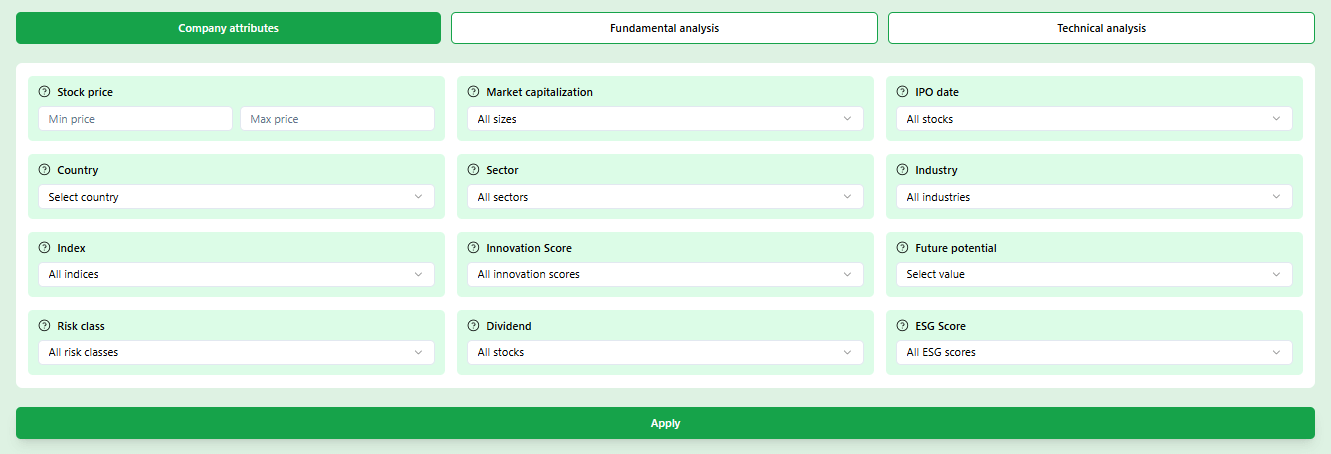
Most investors spend hours reading analyst reports and still end up uncertain. Belegget's stock analysis app cuts that time to minutes by combining a guided questionnaire with 36 professional filters across fundamentals, technicals, and global sectors — covering 25,000+ stocks from 52 countries.
✓ Instant access · ✓ No credit card required
Don't know where to start? The Smart Filter in our stock analysis app does it for you
Not every investor wants the same thing. Someone building a retirement portfolio thinks differently than someone looking for short-term momentum plays. The guided questionnaire in our stock analysis app recognises that and tailors results accordingly — without requiring you to know anything about financial ratios upfront.
Holding period
Short-term trade, medium-term hold, or long-term compounder — the app adjusts the metric weighting automatically
Company profile
Industry leader, challenger brand, or early-stage growth story — each has different signals worth watching
Growth phase
Aggressive expansion or stable earnings machine — the filter logic shifts to match what matters for that stage
36 filters. All in one stock analysis app. No spreadsheet required
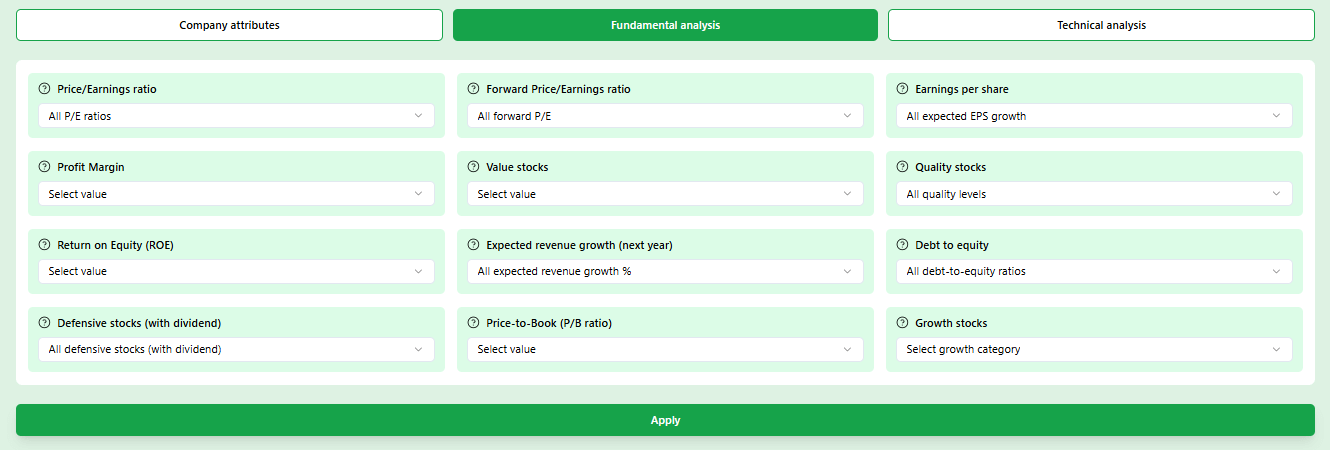
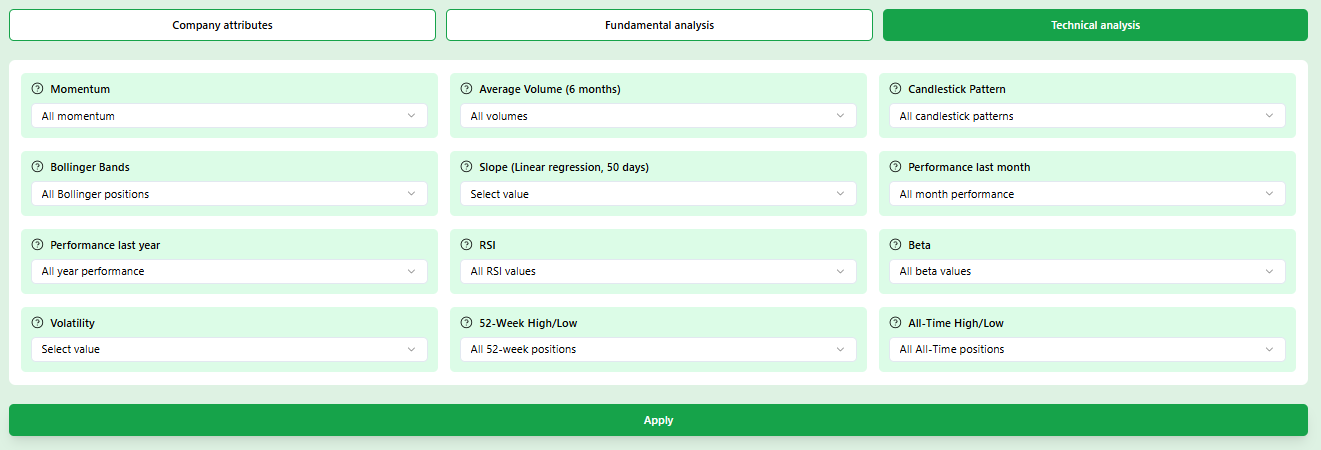
You can build the same filter setup manually across Bloomberg, Finviz, and a spreadsheet. Or you can set it up in our stock analysis app in about forty-five seconds. The filters cover every angle a serious investor needs — fundamentals, technicals, dividends, market cap, sector, and geography.
Fundamental filters
P/E, P/B, EV/EBITDA, revenue growth, free cash flow, debt ratios
Technical filters
RSI, 52-week range, momentum, Bollinger Bands, BEA signals
Combine without limits
Stack multiple filters at once for a very precise shortlist
Five things you can do with the Stock Analysis App that save real time
A stock analysis app is only useful if it gives you answers to the questions you actually have. Here is how each part of Belegget helps you get there.
Filter by the numbers that match your strategy, not just the popular ones
Most investors default to P/E ratio because it is the most talked-about metric. But a growth company with a high P/E and accelerating revenue is a very different investment than a value stock with a low P/E and flat earnings. This stock analysis app lets you combine the metrics that matter for your specific approach. A dividend investor might filter for yield above 3%, payout ratio below 60%, and ten consecutive years of dividend increases. A momentum trader might filter for stocks within 5% of their 52-week high with RSI between 55 and 70. Both take about thirty seconds to set up, and the results update instantly.
Compare stocks side by side without switching tabs
When you have narrowed a list down to three or four candidates, the natural next question is: which of these is actually the best option right now? The stock analysis app puts them on a single screen with the same metrics for each company displayed in aligned rows. Revenue growth for all four. Profit margin for all four. Debt levels for all four. You see the outliers immediately. No copy-pasting into a spreadsheet, no cross-referencing multiple browser tabs. The decision that used to take forty minutes now takes ten.
Understand dividend stocks beyond the yield number
A 7% dividend yield sounds attractive until you notice the payout ratio is 110% and earnings have declined for three consecutive years. Yield alone is one of the most misleading numbers in investing. This stock analysis app shows you the full picture: current yield, payout ratio, dividend history going back multiple years, and earnings coverage. You can filter for companies that have not cut their dividend in at least five years, or for those with a growing payout alongside growing earnings. The goal is not to find the highest yield — it is to find the yield you can actually count on twelve months from now.
Read technical signals without becoming a technical analyst
Technical analysis has a reputation for being either overly complex or unreliable. The truth is that a small number of signals carry most of the practical value. RSI tells you whether a stock is in overbought or oversold territory. The distance from the 52-week high tells you whether you are buying near resistance or in the middle of a consolidation. Momentum over three and six months tells you whether the trend is strengthening or fading. The stock analysis app surfaces these signals with plain-language labels so you understand what each number is telling you, not just what the number is.
Build a watchlist that becomes your research memory
Most people bookmark stocks they want to follow and then forget why they added them two weeks later. A watchlist inside a stock analysis app works differently because the context travels with the stock. You see the current price, how it has moved since you added it, and all the metrics that made you interested in the first place. Belegget lets you organise stocks into named lists — one for dividend candidates, one for growth plays, one for stocks you already hold — and set price alerts for any of them. Over time, the watchlist becomes a genuine research journal rather than a forgotten collection of tickers.
Manual research vs. using a stock analysis app
The difference is not just speed. It is the quality of decisions you make with the time you save.
Time to first shortlist
Without a dedicated tool, screening 25,000 stocks manually across fundamentals and technicals takes several hours — even with access to paid data terminals.
Global coverage
Most free tools focus on US stocks. European, Asian, and emerging market companies are often missing or poorly covered, which creates blind spots in diversification.
Consistent methodology
When you do research manually across multiple sources, the metrics are not always calculated the same way. One site uses trailing P/E, another uses forward P/E. Comparisons break down.
Acting on good ideas
The gap between finding an interesting company and actually understanding it well enough to act is where most investors get stuck. A stock analysis app with plain-language explanations closes that gap.
Manual vs. Stock Analysis App
Your next investment idea is already in the data
Create a free account and see which stocks the stock analysis app finds for your strategy. The first shortlist takes about two minutes.
✓ No credit card required · ✓ Instant access · ✓ Free basic plan
Why investors use Belegget over other tools
Built for the way individual investors actually work, not for institutional trading desks
Frequently asked questions about the Stock Analysis App
Questions we hear often from investors who are new to the app
More guides to help you find the right stocks
A good stock analysis app is one piece of the puzzle. These guides cover the broader process of finding, filtering, and selecting stocks worth your attention.
How do I find good stocks?
A practical framework for identifying quality stocks before you open any screener. Understand what separates a genuinely interesting company from one that just looks good on paper.
Simple stock screener
Not every investor needs 36 filters. This guide walks through how to get meaningful results with just a handful of well-chosen criteria — ideal if you are getting started with screening.
Dividend stock screener
Dividend investing has its own logic. This guide explains which filters matter most when you are looking for reliable income stocks and how to avoid the high-yield traps that catch many investors.