Stock Compare Tool: see exactly which stock fits your strategy

Use the Belegget stock compare tool to evaluate any two stocks side by side on P/E, growth, margins and debt. Learn which metrics matter most before making your investment decision.

Create Free Account

Side by side clarity

The metrics that matter

Filter first, compare second

Confident decisions

Most investors pick stocks based on a tip or a headline. The investors who consistently make better decisions use a stock compare tool to evaluate companies on real numbers: earnings, growth, margins, debt. That is exactly what Belegget is built for.

Six metrics every stock compare tool should show you

You do not need to analyze fifty numbers. These six give you a complete picture of any company and reveal which one fits your strategy better.

How much you pay per euro of annual profit. Only meaningful when compared within the same sector.

A high P/E is far easier to justify when revenue growth is strong and accelerating.

Shows how efficiently a company converts sales into actual profit. Sector context is essential.

Companies with low debt absorb downturns. High debt amplifies both good times and bad.

Only relevant for income investors. Always combine with the payout ratio to judge reliability.

Measures how effectively the company uses shareholder capital to generate profit. Compounding at its core.

Two stocks. Five metrics. One clear picture.

Choosing between two stocks looks hard when you read about them separately. The moment a stock compare tool places them side by side on the same criteria, the picture becomes completely different. One company might be cheaper by valuation but carry weaker growth. The other might be pricier but generating outstanding margins and no debt.

That context is what actually drives good decisions. The animation on the left shows how Belegget's stock compare tool surfaces that comparison — illustrative example, not live data. Your real comparisons happen on the stock detail pages inside the platform.

Valuation side by side

P/E, P/B and EV/EBITDA in direct comparison

Growth and profitability

Revenue growth, net margin and return on equity

Financial resilience

Debt levels, interest coverage and cash generation

How to use a stock compare tool the right way

Three steps that separate a confident investment decision from a guess

Build your shortlist

Start in the screener. Set your sector, P/E range, growth minimum and market cap. The screener turns 25,000 stocks into 5 to 10 serious candidates in under two minutes.

Open each detail page

Click through to the individual stock page for each candidate. There you find the full fundamental profile: valuation, growth, margins, debt, dividends and technical signals together.

Score on your criteria

Compare your candidates on the same five metrics. Whichever scores better on the criteria that match your strategy — income, growth, value or stability — is your strongest candidate.

Build your shortlist, then open the stock compare tool

The stock compare tool works best when you already have two or three serious candidates worth your attention. That is exactly what the screener delivers. Set your criteria and the filter reduces the global stock universe to a focused shortlist — the right starting point for any meaningful comparison.

36 professional filters

From P/E ratio and profit margin to RSI and 52-week position

Instant shortlist

Thousands of stocks down to your best candidates in minutes

Stack filters freely

Combine sector, size, valuation and growth in any order

Growth strategy vs income strategy: what changes

The same five metrics carry different weights depending on what you are trying to achieve

Illustrative framework. Individual companies may deviate from these general patterns.

Ready to compare stocks on what actually matters?

Build your shortlist with the screener and compare your top candidates side by side on the metrics that drive real investment decisions.

✓ Free to start  ·  ✓ No credit card  ·  ✓ Cancel anytime

Why investors use Belegget to compare stocks

What the stock compare tool reveals about any company

Five practical comparisons that experienced investors run before committing capital

Ready to use the stock compare tool?

Find your candidates with the screener and use the stock compare tool to evaluate them on the metrics that actually drive investment decisions.

Frequently asked questions about the stock compare tool

The questions most investors ask before doing their first serious stock comparison.

More ways to find the right stocks

Once you have mastered comparison, these guides help you build a better shortlist to start with.

Mobile Stock Screener

Screen stocks on your phone with the same filters you use on desktop. No compromises on the go.

Simple Stock Screener

Not ready for 36 filters? Start here. A straightforward screener that gets you to a solid shortlist fast.

Growth Stock Screener

Looking for companies with strong revenue growth and expanding margins? This guide walks you through it.
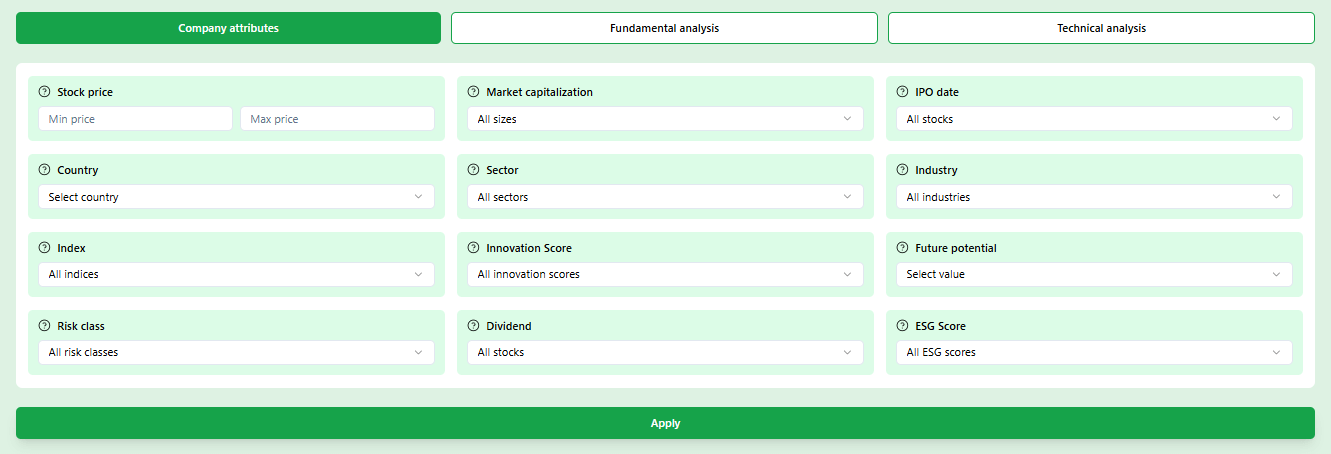
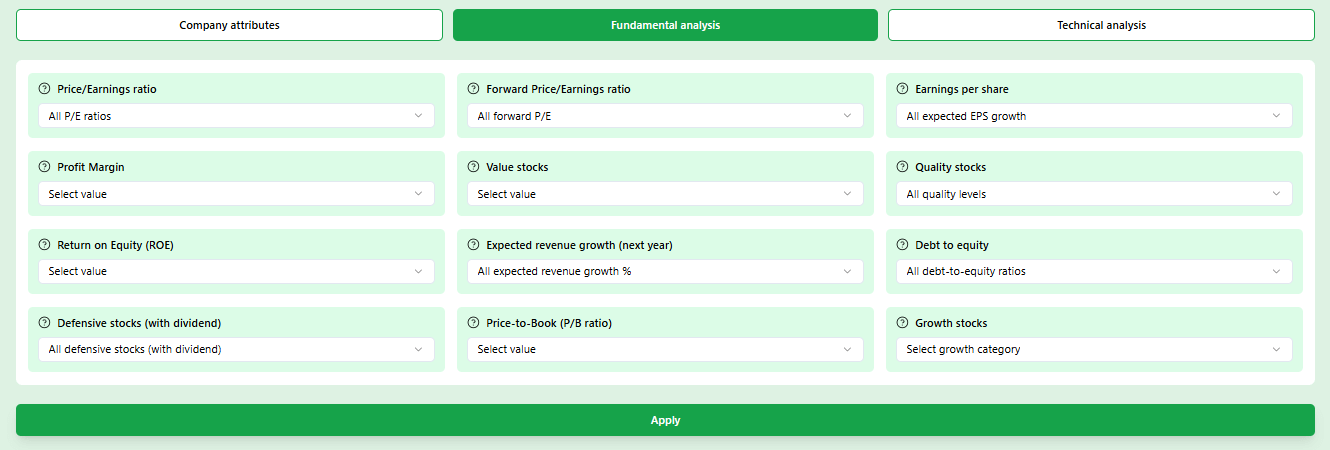
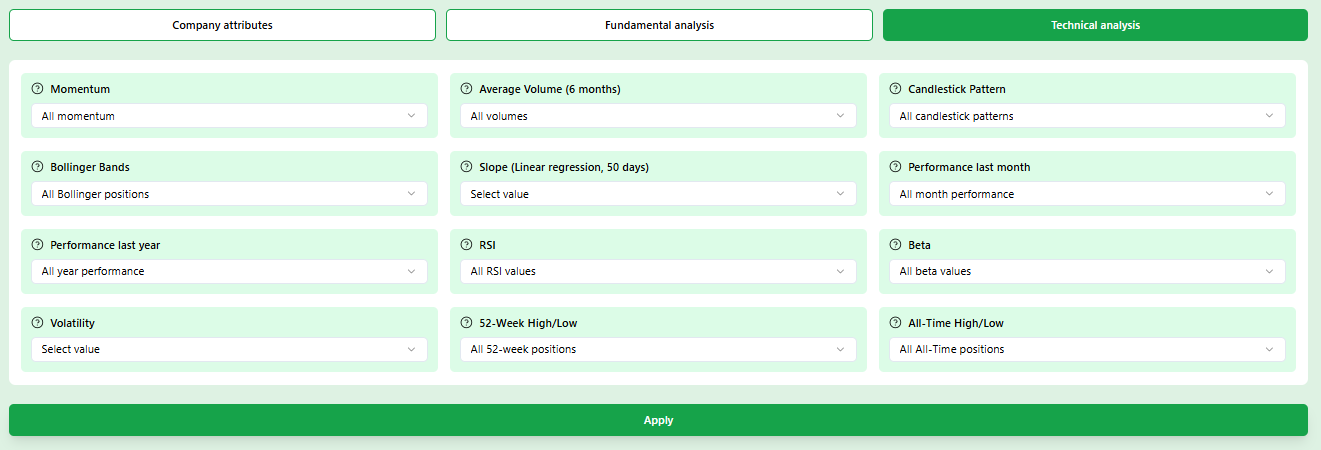
stock compare tool general filters and search overviewstock compare tool fundamental filter optionsstock compare tool technical analysis filter viewstock compare tool P/E ratio valuation comparison between two stocksstock compare tool revenue growth versus dividend yield comparisonstock compare tool debt equity ratio balance sheet comparisonstock compare tool sector based stock filtering for better comparisonstock compare tool combining technical and fundamental analysis for stock selection

Benefits

Side by side clarity

Place any two stocks next to each other across all key metrics in one structured view — no tab switching, no memory required.

The metrics that matter

P/E, P/B, revenue growth, profit margin and debt-to-equity: the five numbers experienced investors check first in any comparison.

Filter first, compare second

Build your shortlist with 36 professional filters, then open each detail page to do your real side-by-side comparison.

Confident decisions

Structured data removes guesswork. You see which stock fits your strategy before you invest, not after.

Frequently Asked Questions

What is a stock compare tool and how is it different from a screener?
A screener helps you find stocks that meet specific criteria. A stock compare tool helps you evaluate two or more specific stocks side by side on the same metrics at the same time. In Belegget, the workflow combines both: use the screener to build a shortlist, then open each detail page to do your real comparison. The two steps work together.
Which metrics are most important when comparing two stocks?
Start with five: the P/E ratio (how much you pay per euro of earnings), revenue growth (how fast the company is expanding), the profit margin (how efficiently it converts sales to profit), the debt-to-equity ratio (how much it relies on borrowed money) and the dividend yield if income matters to you. These five together give you a solid foundation for any comparison.
What is the difference between P/E and P/B ratio in a stock comparison?
The P/E ratio compares the share price to annual earnings — a P/E of 18 means you pay 18 times the yearly profit. The P/B ratio compares the market price to the accounting book value of the company. Banks and industrial companies are typically judged by P/B because their assets are central to the business. Tech and software companies are better evaluated on P/E or revenue multiples.
Should I compare stocks from different sectors?
Cross-sector comparisons are usually misleading. A 10% profit margin is ordinary for software and outstanding for retail. A debt-to-equity of 1.0 is high for a consumer goods company but normal for real estate. When you compare within the same sector, the differences between companies become meaningful. Cross-sector comparisons are only useful when you are deciding between two different portfolio roles.
How do I use Belegget to compare stocks in practice?
Start with the screener and set your filters — sector, market cap, P/E range, revenue growth minimum. This narrows the universe to companies that match your thesis. Then open the detail page for each candidate. There you will find the full fundamental overview including all the metrics you need for a proper side-by-side evaluation.
What does a high debt-to-equity ratio mean when comparing stocks?
A high debt-to-equity ratio means the company funds a significant part of its operations through borrowed money rather than shareholder equity. This is not automatically bad — real estate and utilities routinely carry more debt — but in combination with rising interest rates or slowing revenue it increases risk substantially. Always check it alongside the interest coverage ratio before drawing conclusions.
Is it better to compare growth stocks or value stocks?
Neither category is better — they serve different purposes. A growth stock comparison helps you find which company has the stronger runway and the most compelling expansion story. A value stock comparison helps you find which company is most underpriced relative to its earnings or book value. The right comparison depends on what role you want the stock to play in your portfolio.
Do I need a paid subscription to compare stocks on Belegget?
Basic access to the screener and stock detail pages is free. A premium subscription unlocks unlimited filter usage, the full Smart Filter quiz experience and deeper fundamental data across thousands of stocks worldwide. Premium starts at €12.99 per month.