Most investors spend hours browsing financial news, comparing tabs, and second-guessing themselves before placing a single trade. Belegget replaces that scattered process with one structured platform: a smart questionnaire that matches you to the right companies, combined with professional filters across fundamentals, technical indicators, sector, and region. Over 25,000 stocks from 52 countries. Updated every day.
✓ Immediate access · ✓ No credit card required
Answer a few questions and get a curated list of matching stocks
The smart questionnaire is what separates Belegget from a standard screener. Instead of forcing you to choose between 36 filters without knowing where to start, it asks what matters to you: how long you want to hold, what kind of company you are looking for, and what growth stage interests you. The platform then selects and applies the right combination of filters on your behalf.
No filter knowledge needed
The questionnaire translates your preferences into filter logic automatically
Results in under two minutes
From zero to a shortlist of relevant companies without any manual setup
Fully adjustable afterwards
Refine the results by adding or removing individual filters once you see the list
Prefer to set filters yourself? Go as deep as you want.
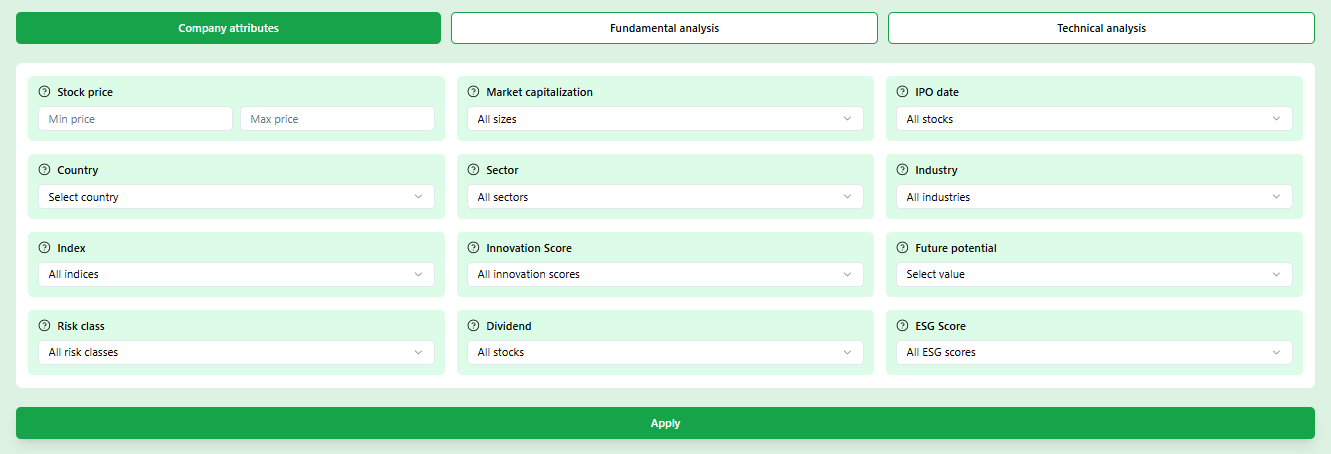
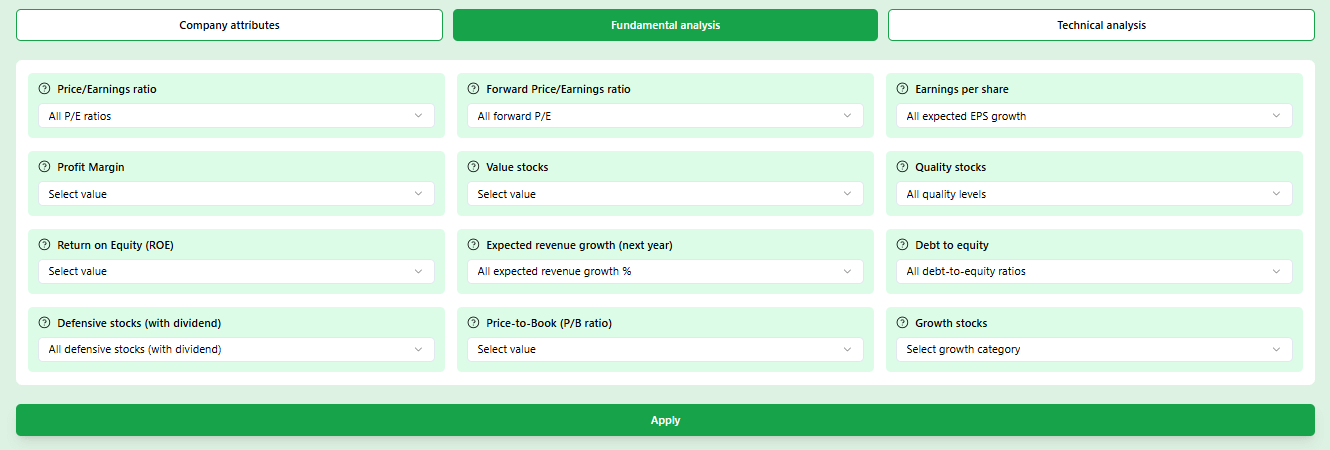
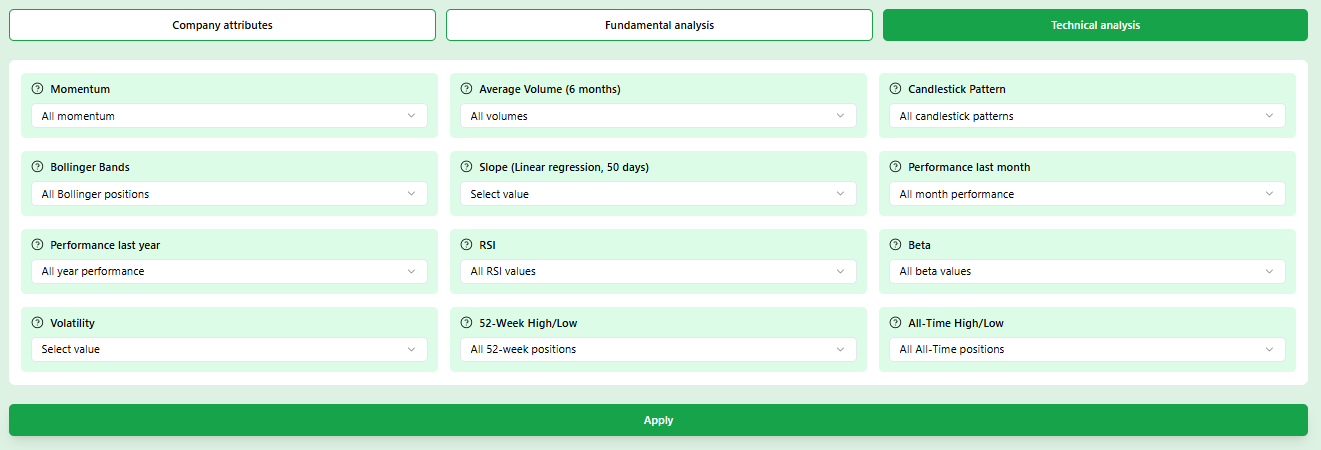
For investors who already know what they are looking for, the manual filter tool gives you full control. Thirty-six filter options across three categories let you build precise search criteria based on the fundamentals, technicals, or company profile that matter to your strategy.
Fundamental filters
P/E ratio, revenue growth, dividend yield, debt-to-equity, free cash flow and more
Technical filters
RSI, momentum, 52-week range, Bollinger Bands, volatility and candlestick patterns
Company profile filters
Sector, country, exchange, market cap, and IPO year to target exactly the right market segment
What do stock research tools actually do?
The term covers a wide range of software. Here is what distinguishes a serious research platform from a basic price tracker.
A stock screener
Filters thousands of stocks down to a shortlist based on criteria you define. Instead of browsing endlessly, you set parameters and get matching results instantly.
A fundamentals analyzer
Shows you the financial health of a company: revenue trends, profit margins, debt levels, cash flow. The kind of data that sits inside quarterly reports, made readable at a glance.
A technical analysis filter
Identifies stocks showing patterns or signals relevant to timing: momentum, RSI, 52-week positioning. Useful for investors who pay attention to entry points.
A watchlist and portfolio tracker
Saves companies you want to monitor over time and gives you a structured overview of where you have invested and what is moving.
Belegget vs. a free screener
What you can filter on inside the platform
Thirty-six filter options across three main categories. Each one targets a different dimension of stock analysis.
Company profile
Ready to filter 25,000 stocks in minutes?
Create a free account and start narrowing the market down to stocks that actually fit your strategy.
Why investors choose Belegget
Built for independent investors who want professional tools without the complexity of institutional platforms
One platform
Screener and comparator
25,000 stocks
Always current
Five ways serious investors use these tools
Each workflow solves a real research problem that most investors face weekly.
Building a first shortlist from scratch
When you sit down to research stocks without a clear starting point, the sheer volume of options is paralyzing. 25,000 companies across dozens of markets and no obvious place to begin. The questionnaire solves this by asking the right questions first. You answer what kind of company interests you, what holding period suits you, and what growth stage you prefer. The platform translates those answers into filter criteria and returns a focused shortlist of companies that genuinely match. Instead of spending the first hour figuring out where to look, you arrive at a meaningful list within two minutes and spend the rest of your session actually researching.
Checking if a stock is financially healthy before going deeper
You have found a company that sounds interesting from the news or a recommendation. Before spending time on a deep dive, you want to know if the numbers hold up. That means checking whether the revenue is actually growing, whether the profit margins are expanding or contracting, what the debt situation looks like, and whether the cash flow supports the valuation. Doing this manually requires pulling data from multiple sources and making sense of quarterly reports. Inside the platform, this information is already structured and ready to read. You can see whether a company is financially healthy or fragile in the time it takes to scroll through a single page.
Finding opportunities in a specific sector or country
Sometimes you have a thesis: you believe renewable energy is going to outperform over the next three years, or you want exposure to European small caps, or you think healthcare technology is undervalued right now. Turning that thesis into an actual list of stocks to research is harder than it sounds. The sector and country filters let you isolate exactly the part of the market you want to explore, then layer fundamental criteria on top. You might filter for European healthcare companies with revenue growth above 15 percent and a P/E below 20. That combination alone narrows thousands of companies to a manageable handful worth serious attention.
Monitoring your watchlist without checking every day
One of the most underrated parts of stock research is what happens after you find a company you like but are not ready to buy. You want to keep an eye on it without doing the full analysis again every week. The watchlist feature lets you save companies and organize them into separate lists based on your strategy or stage of conviction. The platform sends notifications when significant changes happen, whether that is a price movement, a fundamentals update, or a new signal from your filters. You stay informed without having to actively monitor, which means your research time stays focused on new opportunities rather than checking on ones you already know about.
Timing a potential entry with technical signals
Fundamental analysis tells you whether a company is worth owning. Technical analysis gives you a view on whether now is a good moment to buy it. If you have identified a quality company but the valuation still feels high, or you want to wait for a pullback before entering, the technical filters help you monitor the timing. RSI below 30 suggests the stock may be oversold and approaching a reversal. Momentum turning positive after a period of weakness can signal renewed buying interest. A stock trading near its 52-week low with strong fundamentals is exactly the kind of setup value investors look for. The platform lets you filter for these conditions across the entire database so you catch the timing signal when it appears.
Frequently asked questions
Questions investors ask before they start using the platform
Start researching stocks with the right tools today
Create a free account and use the questionnaire and filter tool to find the stocks that match your strategy. No credit card, no commitment.
More guides on finding and filtering stocks
Each guide covers a different angle on stock screening, from setting up alerts to finding the simplest way to get started.
Stock Screener
How a stock screener works, what filters matter most, and how to use one effectively as part of your research process.
Easy to Use Stock Screener
Not all screeners are built the same. This guide shows what separates a screener that is actually usable from one that is technically powerful but practically confusing.
Stock Screener with Alerts
How to set up alerts so the platform tells you when a stock you are watching meets your criteria, without having to check manually every day.