Value Score that already does the sector math
Quality filter that removes value traps
15 filters built for value investors
25,000+ stocks across 52 countries
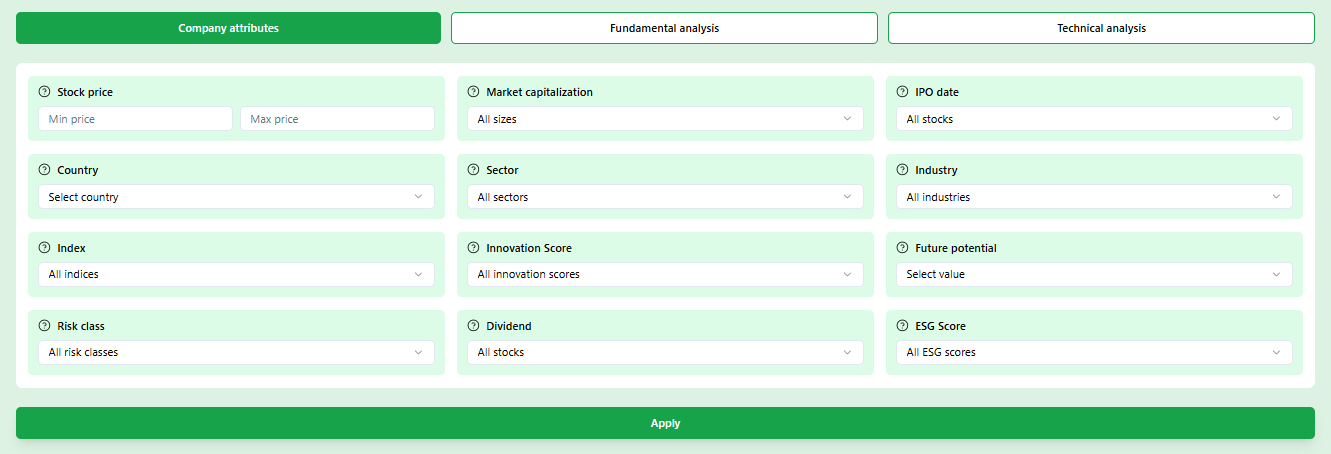
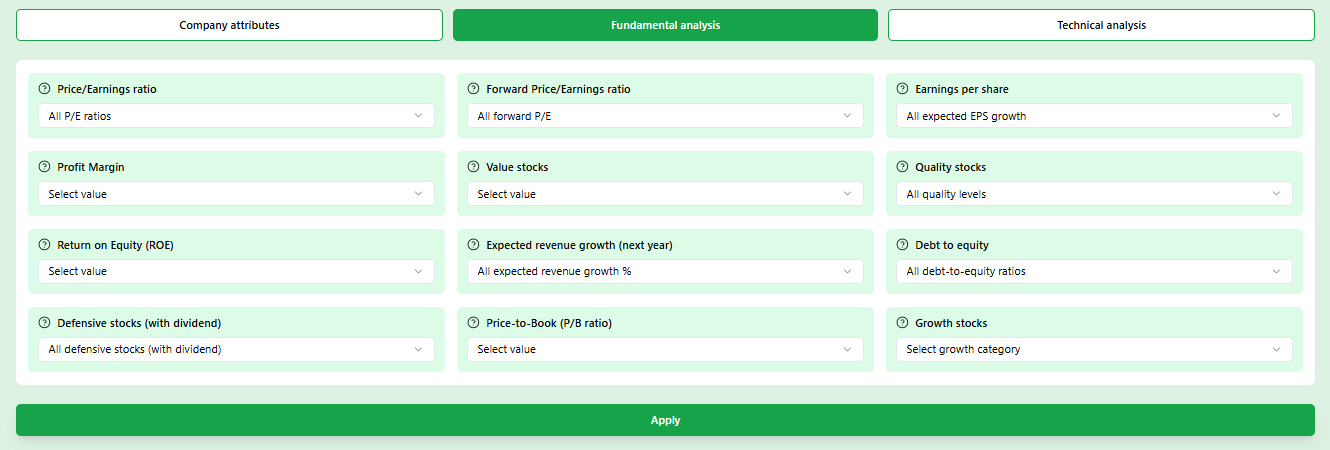
A low valuation does not always mean a stock is undervalued. This undervalued stock screener helps you look beyond a single metric by combining valuation, quality, and financial health indicators. Filter stocks using measures such as P/E ratio, price-to-book ratio, free cash flow yield, and value score to create a shortlist tailored to your investment approach.
✓ No account needed to explore · ✓ 25,000+ stocks · ✓ 52 countries
Use the undervalued stock screener — set your filters and search
All filters load directly from Belegget. Combine value score, P/E ratio, sector and quality score to build your shortlist. No account needed for the first searches.
What separates undervalued from just cheap — five metrics that matter
Understanding which signals are meaningful in which context is what turns a screener from a list generator into a genuine research tool.
Not sure which filters to set? Let the Smart Filter ask the right questions
Three targeted questions about your investment horizon, preferred company type and sector interest — and the screener builds your filter combination automatically. It narrows 25,000 stocks to a focused shortlist without you needing to know which P/E threshold to start with.
Investment horizon
Short term opportunistic or long term compounding — the filter set shifts accordingly
Company stage
Mature cash generators or earlier businesses trading below intrinsic value
Sector focus
Financials, consumer goods, industrials — value appears differently in each
Combine undervalued stock screener filters for a precise shortlist
Set P/E ratio, market cap and country independently, then layer in the value score or quality filter on top. Each combination you choose tells the screener something more specific about what you are looking for.
P/E ratio 10 to 20
Filters out expensive growth stocks and focuses on value territory
Market cap $2B to $10B
Mid caps where institutional coverage is lower and mispricings more frequent
Country or sector focus
Narrow to the markets and industries where you have genuine knowledge
Ready to find what the market is currently mispricing?
Create a free account and access the full undervalued stock screener with value score, quality filters and Smart Filter — no credit card required.
✓ Free to start · ✓ No credit card · ✓ Cancel anytime
What the undervalued stock screener does differently
Four reasons the filter set produces a more useful shortlist than a standard P/E screen
Questions about the undervalued stock screener
Real questions from investors using the screener for the first time
More value investing tools and guides
Explore related screeners and guides to sharpen your approach to finding undervalued investment opportunities.
Intrinsic Value Stock Screener
Find stocks trading below intrinsic value using DCF analysis, analyst price targets and margin of safety calculations.
Value Investing Stock Screener
The complete value investing screener: filter by value score, quality, dividend safety and sector context for a disciplined approach.
Growth Stock Screener
Compare undervalued stocks with high growth alternatives — sometimes the best value is in tomorrow's compounders.
Frequently Asked Questions
- What does the Value Score filter actually calculate?
- The value score is Belegget
- Why is a low P/E ratio not enough to find genuinely undervalued stocks?
- A low P/E can mean three very different things: the company is genuinely underpriced, the sector always trades at low multiples, or the market is pricing in deteriorating earnings. Without sector context and a quality check, a low P/E screen fills your list with banks, utilities and companies with declining profits. The undervalued stock screener addresses this by letting you combine P/E with the value score and quality filters simultaneously.
- What is the difference between undervalued and just cheap?
- A cheap stock has a low valuation metric. An undervalued stock has a low valuation metric that does not reflect the company
- How many results should I expect when filtering for undervalued stocks?
- It depends on your filter combination and market conditions. In a broadly expensive market, filtering for undervalued plus high quality might return 30 to 80 stocks globally. After significant market corrections, that number rises substantially. Applying sector or country filters will narrow the list further. A shortlist of 15 to 40 stocks is a productive starting point for deeper research — enough variety to compare, small enough to actually read each company
- Should I use the Value Score filter or set my own P/E and P/B combination?
- Both approaches work well. The value score is faster and already accounts for sector context without you needing to configure it manually. Building your own combination with explicit P/E, P/B and quality filters gives you more control and forces you to think about what you are actually looking for. For most investors starting with value investing, the value score filter combined with sector and quality score is the cleaner entry point. More experienced investors often prefer setting explicit ratio thresholds.
- What is a value trap and how does the quality filter help me avoid it?
- A value trap is a company that looks undervalued on every metric but is actually priced correctly because its business is deteriorating. Declining revenue, shrinking margins and rising debt are the typical warning signs. The quality score in the undervalued stock screener flags these patterns by combining ROE trend, profit margin stability and debt levels. It does not guarantee you will never buy a value trap, but it removes the most obvious cases before you spend research time on them.
- Can I use the undervalued stock screener without a premium account?
- Yes. The basic version includes P/E ratio, price to book, debt to equity, profit margin, return on equity, market cap, country and sector filters at no cost. Premium filters include the value score, quality score, forward P/E and the Smart Filter questionnaire. Many investors find the free combination of P/E plus quality fundamentals already generates a productive shortlist before deciding whether the full filter set adds enough value to upgrade.
- How current is the data in the screener?
- Stock prices and daily metrics update continuously during market hours. Fundamental data including P/E, P/B, revenue figures and margins updates when companies report results, typically quarterly. The value score recalculates automatically when new fundamental data arrives. You are working with current information rather than data that is months behind the market.