Best Stock Analysis App for Beginners: start without the confusion

Find the best stock analysis app for beginners. Smart filters, plain-language explanations, and a guided stock finder that works even if you have zero investing experience.

Create Free Account

The best apps for beginner investors share one quality: they do not ask you to already know what you are doing. Belegget meets you where you are, guides you toward stocks that match your goals, and explains each metric in plain language so the learning happens naturally as you research.

✓ Immediate access  ·  ✓ No credit card required

Three reasons most beginners stop analyzing stocks after the first week

Investing is not complicated by nature. The best apps for beginner investors remove the three walls that make it feel that way. Here is what those walls are and how they are solved.

The jargon wall

25,000 choices, no structure

Analysis paralysis

Your first three steps as a beginner investor

Most beginners do not need more data. They need a clear starting point. Here is the path from zero to a personal shortlist.

Answer a few questions

Use the Smart Filter to describe your investment horizon, preferred company type, and risk level. The platform converts your answers into a filtered stock list immediately. No spreadsheet required.

Open one company page

Pick any stock from your list and open its company page. Look at the revenue trend, the P/E ratio versus the sector average, and the debt level. Three data points are enough for a first impression.

Save your favorites

Add any stock you want to follow to your watchlist. Come back in three months and compare what happened to what you expected. That comparison is how pattern recognition develops.

Answer a few questions and see a stock list built around your goals

You do not need to know what a P/E ratio is to get started. The Smart Filter asks where you are, what you are looking for, and how much risk you want to take. Based on your answers, it builds a filtered list from 25,000 global stocks in real time.

Questions in plain language

No financial jargon. Every question is written for someone who is investing for the first time

Each answer shapes the next question

The questionnaire adapts to what you choose, so the result fits your actual situation

Immediate results

You see your personal stock list the moment you complete the three questions

Once you understand the basics, take full control with manual filters

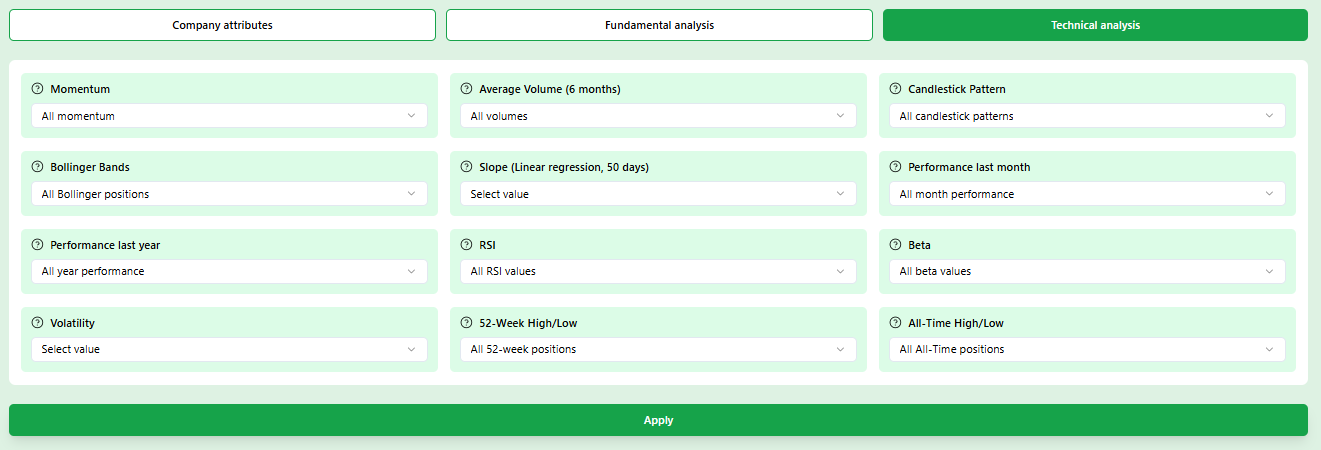
After your first shortlist, you will naturally want to refine your search. The filter panel gives you over 35 criteria to work with, from P/E ratio and revenue growth to RSI and 52-week momentum. You can combine as many as you want and see the result update in real time.

35 filters across fundamental and technical data

Every filter is labeled and explained so you know exactly what it measures

Layer criteria without confusion

Each filter you add shows how many stocks remain so you always know where you stand

Save results to your watchlist

Any stock you find can go directly into your personal watchlist for continued monitoring

Five things that make Belegget work for first-time investors

Each of these features addresses a specific moment in the beginner journey from confusion to confident decision

How the Smart Filter removes 99% of stocks that do not fit you

There are over 25,000 publicly listed companies worldwide. No beginner should have to sort through all of them manually. The Smart Filter works by translating your three answers into a set of filter conditions that run simultaneously against the entire database. The result is a list of typically 30 to 80 stocks that all match your stated goals at once. You are not looking at random results. You are looking at companies that pass your criteria on market phase, size, and investment horizon at the same time. This is a different experience than browsing a screener with no starting point because every item on the list is already relevant before you open a single company page.

What to actually look at when you open a company page for the first time

Filtering for stability before you start thinking about growth

The RSI explained for someone who has never seen a stock chart

Why your watchlist is the most underrated tool in a beginner's first year

Start your first stock search today

Create a free account and use the Smart Filter immediately. No credit card, no setup, no experience required.

Built for investors who are just getting started

The best apps for beginner investors earn that label by removing friction at every step. Here is what that looks like in practice.

Everything explained

Results in 2 minutes

25,000 global stocks

Free to start

Questions beginners actually ask

Specific answers to what first-time investors want to know before they start

About Belegget

Belegget is a stock research and analysis platform built for independent investors. The platform combines fundamental data, technical signals, and guided filtering to help investors at every experience level find stocks that match their personal strategy. Belegget does not provide investment advice and does not execute trades. All investment decisions and their execution remain with the user.

More guides for independent stock research

Once you have your first shortlist, these guides help you go deeper into the research process and find stocks with more precision.

Easy to Use Stock Screener

A practical guide to setting up your first stock screener without getting lost in settings you do not yet need.

Simple Stock Screener

How to find solid stocks by focusing on the three or four criteria that actually matter rather than dozens of overlapping filters.

Growth Stock Screener

Which metrics separate genuine growth companies from ones that only look like growth companies at first glance.
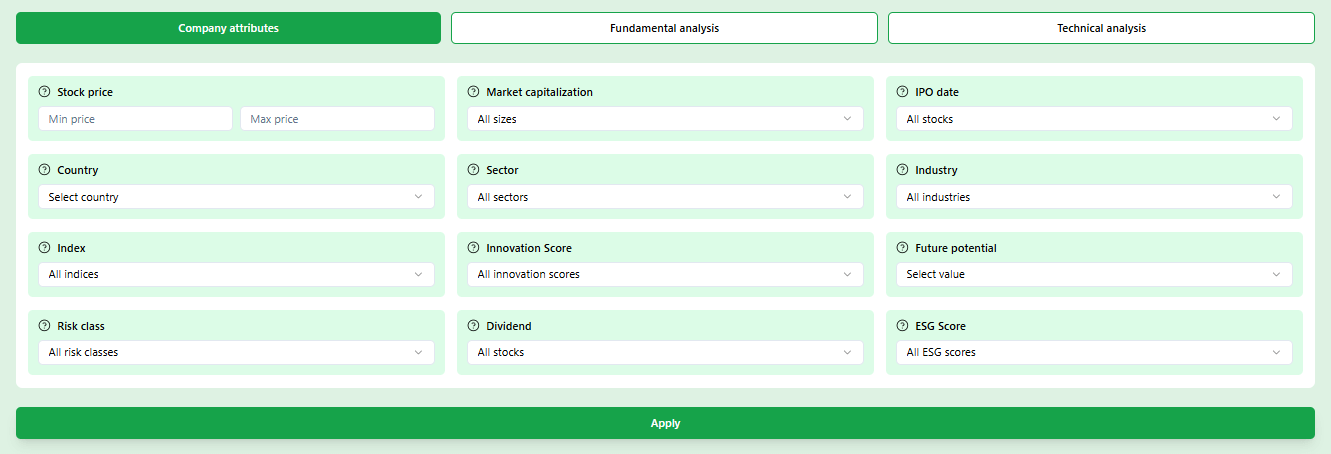
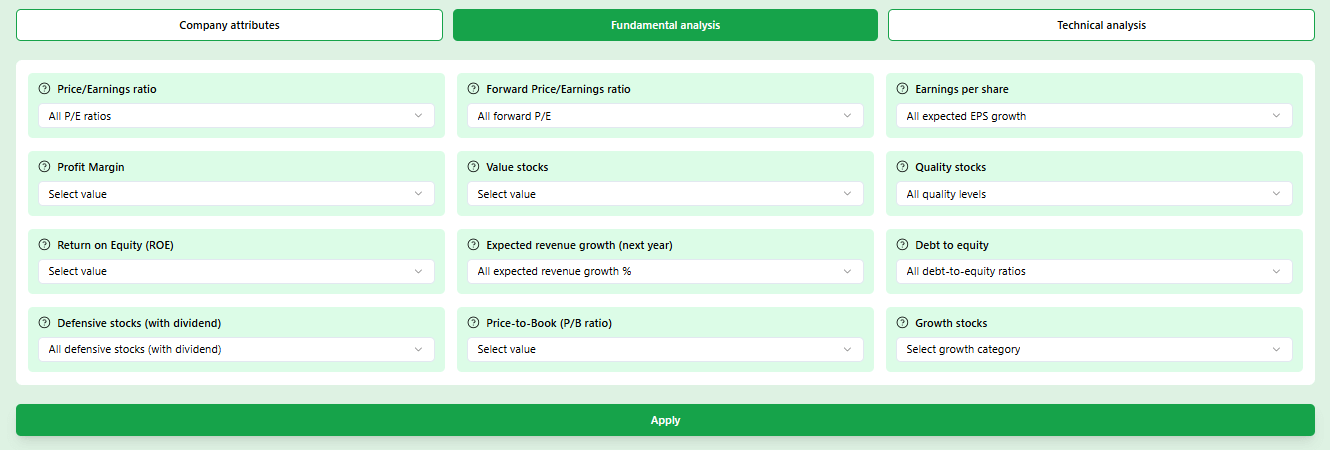
Best stock analysis app for beginners showing general company filter overviewBest Stock Analysis App for BeginnersBest Stock Analysis App for Beginners

Frequently Asked Questions

What makes the best stock analysis app for beginners different from a regular screener?
A regular stock screener gives you a set of filters and expects you to know what to enter. The best stock analysis app for beginners adds a layer of guidance on top of that filtering: it explains what each metric means, suggests starting criteria, and shows you how many stocks remain as you add each condition. The experience is closer to having a knowledgeable friend walk you through the research than to sitting in front of a data terminal and figuring it out alone.
Do I need any financial knowledge to use Belegget as a beginner?
No. Belegget is designed so that you can start without any prior experience. The Smart Filter replaces technical filter settings with plain-language questions about your goals and preferences. Every metric shown on a company page is accompanied by a short explanation so you understand what you are looking at. You will naturally pick up the concepts as you use the platform, which is more effective than studying them in isolation before you start.
What does the Smart Filter actually ask me?
The Smart Filter asks three questions: how long you intend to hold the stock, what type of company you are looking for, and which growth phase the company should be in. Your answers feed directly into the filter logic, which then narrows 25,000 listed companies down to a shortlist of stocks that match all three conditions simultaneously. You see the result immediately. The entire process takes under two minutes.
How do I know which financial metrics to focus on as a beginner?
The most important four metrics for a beginning investor are revenue growth, profit margin, free cash flow, and the P/E ratio relative to the sector average. Revenue growth tells you whether the business is expanding. Profit margin shows how efficiently it operates. Free cash flow reveals whether the company generates real money after paying its operating costs. The P/E ratio helps you judge whether the current price is reasonable given the earnings. Belegget shows all four on the main company overview page so you can form a judgment without hunting across different data sources.
What is a watchlist and why should I start using one immediately?
A watchlist is a personal list of stocks you want to monitor without necessarily buying them yet. The reason beginners benefit from starting one early is that it creates a record of your thinking at a specific moment in time. Six months later you can look back, see whether the stock moved in the direction you expected, and understand why or why not. That pattern recognition is how investors improve. Without a watchlist, you research stocks and then forget what you thought about them.
What should I look at first when I open a company page as a new investor?
Start with the revenue trend over the past three to five years. Is it growing steadily, stagnating, or declining? Then check the P/E ratio and compare it to the sector average shown on the page. A lower P/E than the sector can signal an undervalued opportunity, while a much higher one requires explanation from growth prospects. Finally look at the debt level. High debt relative to earnings makes a company more vulnerable when conditions change. Those three data points take less than a minute to check and give you a solid first impression before you go deeper.
Can I use Belegget without paying?
Yes. Belegget has a free tier that gives you access to the Smart Filter, basic company pages, and fundamental data for all stocks in the database. The free access is enough to run your first searches, understand how the platform works, and build your first watchlist. Premium features like unlimited filter combinations, advanced technical indicators, and full historical data require a paid subscription, which you can upgrade to when you are ready to go deeper.
How does Belegget help with technical analysis if I have no chart experience?
Technical analysis can feel intimidating at first, but Belegget presents the most useful signals in plain terms. The RSI (Relative Strength Index) is shown as a number between 0 and 100 with a label: oversold below 30, overbought above 70, and neutral in between. The 52-week range shows where the current price sits between the annual low and high as a percentage. Momentum compares how the stock has moved over three and six months versus the market. You do not need to know how these are calculated to use them. The label tells you what it means.
Is the data on Belegget current?
Financial metrics including revenue, margins, and balance sheet figures are updated daily from market data providers. Stock prices are current as of the latest trading session. The consistency of update timing across all 25,000 stocks in the database means you are always comparing apples to apples rather than mixing data from different dates when you run a filter.
Can I buy stocks through Belegget?
No. Belegget is a research and analysis platform, not a broker. You use Belegget to find and evaluate stocks, then place the actual purchase order through your own broker. This separation keeps the research experience clean and uninfluenced by trading incentives. Your broker is where you execute. Belegget is where you decide.