All-In-One Analysis
Side-by-Side Compare
25,000+ Stocks
Data You Trust
Researching stocks often means sorting through large amounts of financial data, market information, and company metrics. Belegget brings these insights together in one place by combining fundamental analysis, technical indicators, and a guided stock finder to help you identify stocks that fit your investment strategy more efficiently.
✓ Immediate access · ✓ No credit card required
What are investment analysis tools and why do serious investors use them?
Investment analysis tools are software platforms that bring financial data, filtering, and valuation into one place. Instead of visiting five different sites to piece together a complete picture of a company, you get everything on a single screen with context that helps you interpret it.
You want to find new stocks
You set criteria such as revenue growth above 15%, a P/E below 20, and a market cap above 1 billion. The tool filters 25,000 stocks down to a list of 40 that match all three conditions. Without a screener this would take you most of a weekend.
You want to evaluate one company
You have read about a company in the news and want to know whether the valuation makes sense. Investment analysis tools show the P/E relative to the sector average, the debt level, the revenue trend over five years, and recent technical signals. All within 60 seconds.
You want to review your portfolio
Your existing holdings each have a company page. You check whether the fundamentals that made you buy still hold. Revenue growth slowing? Debt rising? You catch the change before it becomes a problem, not after.
The problem with manual stock research
When you research a stock without dedicated investment analysis tools, you typically open a financial data site for the revenue numbers, a separate charting platform for the technical picture, a broker app for the current valuation, and an industry site for sector context. By the time you have gathered everything, the data is already mixed from four different sources with different update cycles and inconsistent definitions.
This fragmentation causes two problems. First, you lose time reassembling information that should already be in one place. Second, you become inconsistent: you apply the same criteria loosely rather than precisely, which means your decisions are not truly comparable across different stocks.
What investment analysis tools change
A well-built investment analysis tool forces consistency by design. Every stock is measured using the same data set, the same formulas, and the same update frequency. When you set a filter for P/E below 18, every result in the list meets that condition with no exceptions and no manual verification needed.
That consistency is what separates systematic investors from ones who rely on intuition. It does not mean the tool makes decisions for you. It means the tool removes the parts of research that consume time without adding insight, so you can focus your judgment on what actually matters: whether the business is one you want to own.
The Smart Filter: investment analysis tools that ask the right questions
The Smart Filter asks about your investment horizon, preferred company type, and growth phase. Based on your answers it builds a filtered stock list immediately. No formulas to fill in and no financial jargon to decode.
Adaptive questions
Each answer shapes the next question so the result fits your actual strategy
Horizon and risk in one step
Short term or long term, aggressive or conservative — you choose
Instant results
The stock list updates in real time as you complete the questionnaire
Build your own filter combination in minutes
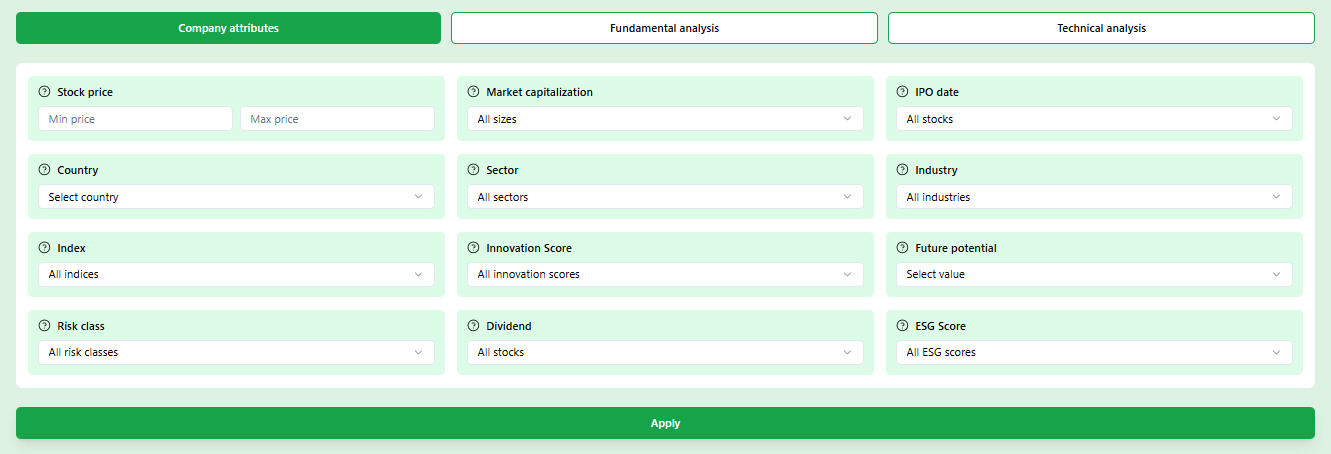
Prefer to set your own criteria? The filter panel gives you over 35 metrics to work with. Combine a low P/E ratio with a minimum market cap and a specific country, and the results update immediately. You see exactly how many stocks remain after each filter you add.
36 professional filters
From P/E ratio and revenue growth to RSI and 52-week momentum
Multi-filter combinations
Layer as many criteria as you need without the results slowing down
Save and revisit
Store your favorite stocks in a watchlist for quick comparison later
What separates a good investment analysis tool from a basic one?
Not all tools are equal. These four qualities determine whether a platform actually helps you make better decisions or just adds more noise.
Basic research vs. Belegget
Data depth
A tool that only shows the current share price is not an analysis tool. You need at minimum revenue growth, profit margin, free cash flow, and debt levels to form a judgment about a company.
Filterability
The ability to combine multiple criteria at once is what separates research from guesswork. If you cannot filter by both fundamentals and technicals simultaneously, you are still doing half the work manually.
Coverage
Limiting yourself to one country or exchange means you miss opportunities. A solid tool covers stocks from at least 40 to 50 countries with consistent data quality across all of them.
Speed and clarity
If you need five minutes to understand one metric, the tool works against you. Explanations should be built in, data should load immediately, and the interface should not bury the most important numbers.
Start finding stocks that fit your strategy today
Create a free account and use the Smart Filter or the advanced filter panel immediately.
Why investors choose Belegget
Built for everyday investors who want professional tools without the complexity
Five analysis methods that belong in every investor's toolkit
Understanding what each method measures — and when to use it — is what turns data into decisions
Fundamental analysis: understanding what a company is actually worth
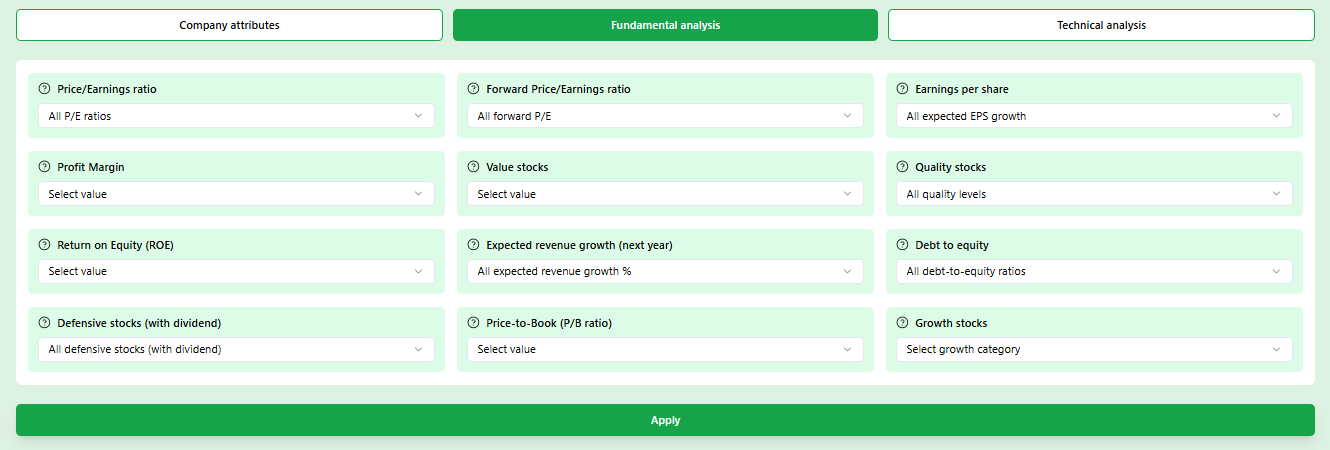
Fundamental analysis looks at the numbers behind the business. Revenue growth tells you whether demand for the product is increasing. The P/E ratio shows how much you pay per euro of earnings. Gross margin reveals how efficiently a company converts sales into profit. Free cash flow tells you how much money remains after the company pays to keep itself running. These four metrics together give you a realistic picture of financial health. A company can have a rising share price but weak fundamentals. Conversely, strong fundamentals with a low valuation often signal an underappreciated opportunity. Belegget shows all of these metrics on a single company page so you can make the comparison in one view.
Technical analysis: reading the chart to time your entry
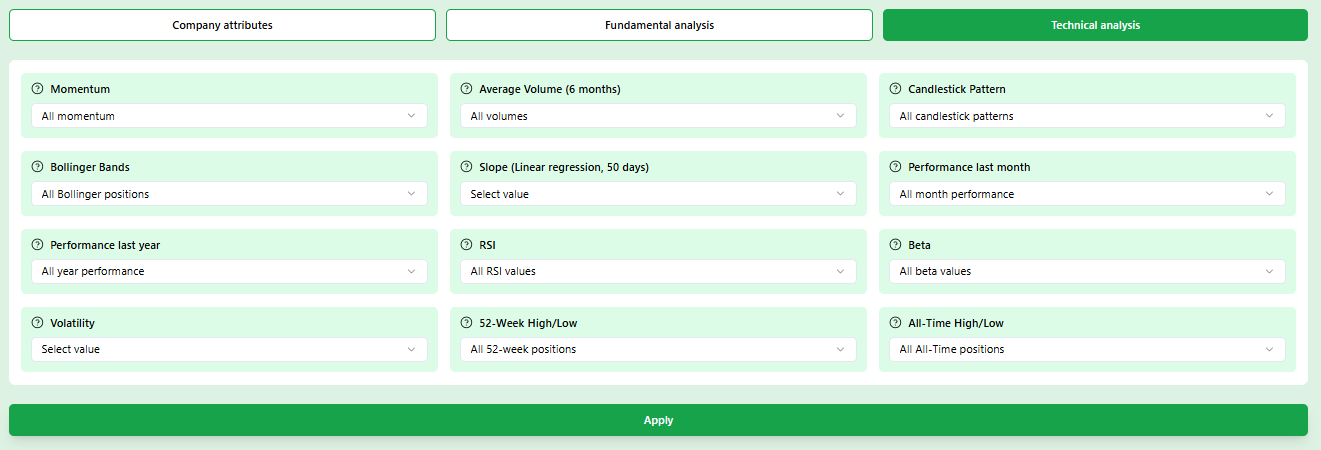
Technical analysis does not tell you whether a company is good. It tells you whether the market is currently pricing it well relative to recent history. The RSI (Relative Strength Index) shows whether a stock is overbought above 70 or oversold below 30. The 52-week range shows where the current price sits between its annual high and low. Momentum compares how much a stock has moved over the last three or six months versus the broader market. A stock that is fundamentally solid but technically oversold is often the combination that experienced investors look for. Belegget includes these signals in the technical filter tab so you can screen for them without opening a separate chart platform.
Valuation analysis: determining whether the price is fair
A stock is not cheap just because it has fallen. And it is not expensive just because it has risen. Valuation analysis gives you reference points to judge whether the current price reflects reality. The Price to Earnings ratio compares the share price to annual profits. The EV to EBITDA ratio strips out debt and tax effects to compare enterprise value to operating earnings, which is especially useful for companies in capital-intensive industries. The PEG ratio extends the P/E calculation by dividing it by the expected growth rate, which prevents you from dismissing a high P/E in a fast-growing company. Together these three metrics give you a richer picture of price relative to value than any single number can provide.
Sector and peer comparison: understanding context
A 15% gross margin means very different things depending on the industry. In retail that is above average. In software it is well below the norm. Sector analysis provides the context to judge whether a number is actually good or just looks good in isolation. Comparing a company to its peers on revenue growth, profit margin, and debt levels shows whether it is leading its category or lagging behind. This type of analysis is especially useful when you are deciding between two similar companies in the same sector. Belegget lets you filter by sector and see multiple companies side by side, which removes the guesswork from peer comparisons.
Risk assessment: building a portfolio that matches your tolerance
Every investor has a different capacity to handle losses. A 30% portfolio drop that one investor accepts as normal might cause another to sell at the worst possible time. Risk assessment gives you concrete data to calibrate your exposure before it becomes a problem. Beta measures how much a stock moves relative to the market. A beta of 1.4 means the stock typically rises 40% more than the market in up periods, but also falls 40% more in down periods. Debt to equity ratio shows how financially stretched a company is. Maximum drawdown tells you the largest historical decline from a peak, giving you a realistic floor to test your patience against. Belegget displays all three on every company page.
Frequently asked questions
Practical answers about how investment analysis tools work and what Belegget offers
Ready to put these tools to work for your portfolio?
Create a free account and start finding stocks that match your goals in minutes.
More ways to find the right stocks
Explore these guides to sharpen your stock selection process and discover which approach fits your investment style best.
Easy-to-use stock screener
How to find the right stocks quickly without spending hours on research or wading through complicated dashboards.
Simple stock screener
A straightforward approach to screening stocks that works whether you are investing for the first time or the hundredth.
Growth stock screener
How to filter specifically for companies that are expanding fast and what metrics actually predict sustained growth.