Deep Fundamentals
All Key Ratios
52 Countries
Data You Can Trust
Most investors pick stocks by watching prices move. Fundamental analysis starts somewhere else entirely. It asks whether the business behind the ticker is actually worth owning. The framework on the right shows exactly what to look at.
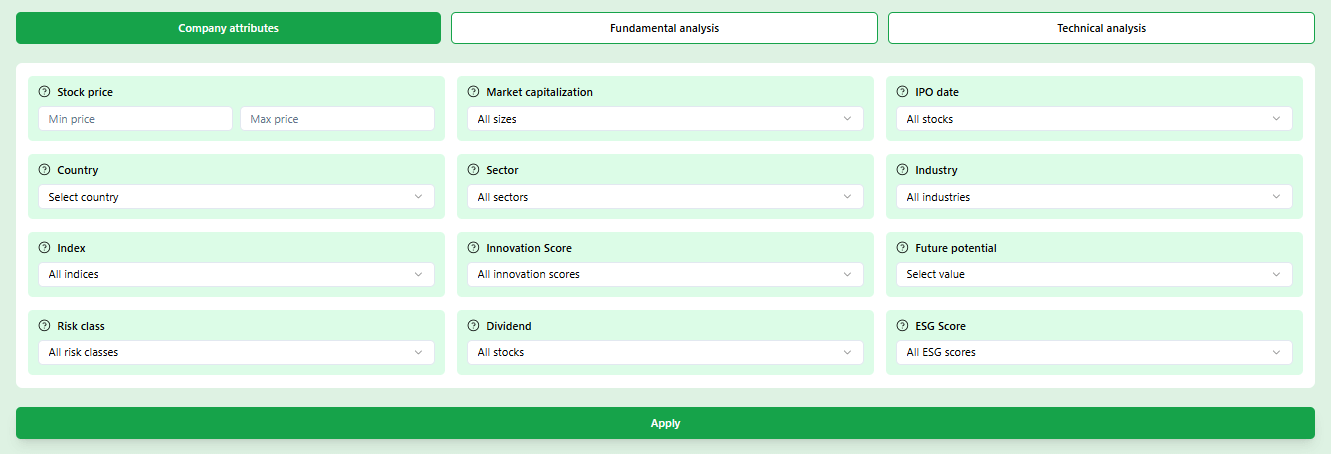
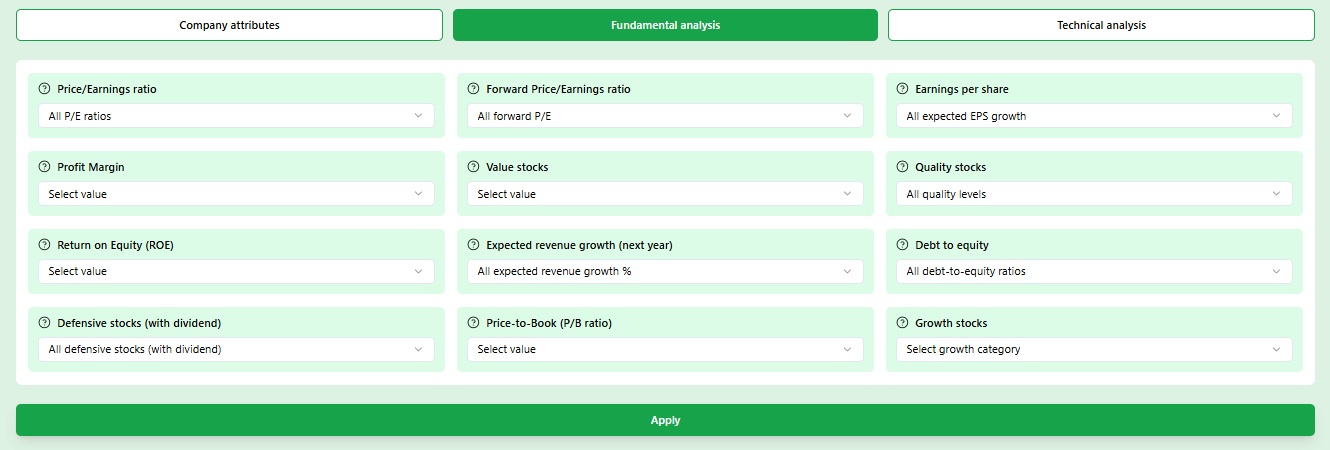
Belegget gives you 36 fundamental filters across 25,000 stocks in 52 countries. Screen by P/E, ROE, revenue growth, free cash flow, and more, and build a shortlist in minutes instead of hours.
✓ Immediate access · ✓ No credit card required
What does stock fundamental analysis actually measure?
Three financial statements, dozens of ratios, one central question: is this business genuinely worth owning at this price?
Income statement
Shows revenue, costs, and profit over a period. The two numbers that matter most are revenue growth (is the business actually expanding?) and net margin (does it keep a meaningful share of every sale?). A company can grow revenue quickly but lose money doing it, which is not automatically bad for a young business but becomes a serious concern as it matures.
Balance sheet
A snapshot of what the company owns versus what it owes. Strong companies have more assets than liabilities, maintain a healthy cash position, and carry debt levels their earnings can service comfortably. The balance sheet is where financial stress shows up first, often months before it becomes visible in the share price.
Cash flow statement
Profit is an accounting figure. Cash is real. Free cash flow (operating cash minus capital expenditure) tells you how much money the business actually generates that could be returned to shareholders, used to pay down debt, or reinvested in growth. Companies that show rising profits but falling free cash flow deserve extra scrutiny.
Valuation ratios
Once you understand the quality of the business, valuation ratios tell you what price you are paying for it. A great business bought at the wrong price is still a bad investment. P/E, P/B, and EV/EBITDA are the most common entry points, but they only become meaningful when compared to historical averages and sector peers.
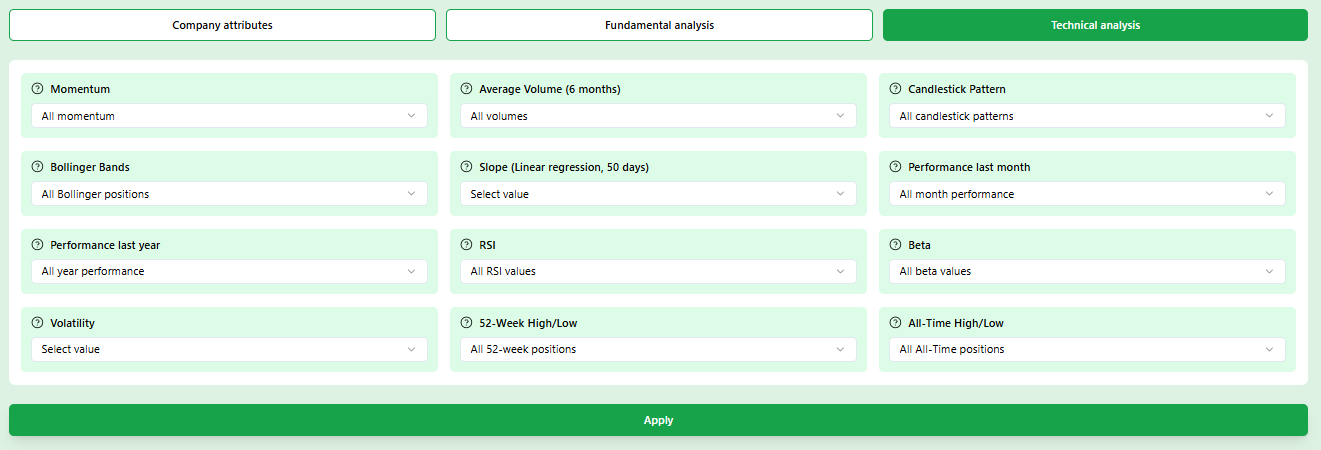
Fundamental vs. technical analysis
Practical tip: Many investors use both. Fundamentals to select what to own, technicals to choose the moment of entry. Neither approach alone tells the full story.
3 costly mistakes investors make without fundamental analysis
These are not edge cases. They happen every day to people who skip the numbers and invest on instinct alone.
Buying a great story at a terrible price
A company with a compelling product and a rising share price feels safe to buy. But if the P/E is already 80 and revenue growth is slowing, the story has already been priced in by the market. You are not discovering anything early, you are arriving late. Fundamental analysis forces you to ask: what am I actually paying for this cash flow? When the answer is uncomfortable, that is information.
Missing balance sheet deterioration until it is too late
Share prices often look fine right up until they do not. A company can report growing revenue for years while quietly accumulating debt, burning through cash reserves, or depending on an unsustainable working capital cycle. None of this shows up in the share price with any warning. It shows up in the balance sheet and cash flow statement months before a profit warning hits. Investors who check only the price chart are reading the last chapter without knowing the plot.
Confusing sector momentum with individual company strength
When a sector is hot, almost every stock in it rises. When the sector cools, most fall. Investors who do not analyse companies individually cannot tell which companies in a sector are genuinely strong and which ones were just carried up by the tide. Fundamental analysis cuts through sector noise by examining each company on its own financial merits. This is how you find the two genuinely solid businesses in a sector of ten mediocre ones.
Not sure where to start? Let the smart filter do the work
Answer a few simple questions about your investment horizon, the type of company you are looking for, and the growth phase you prefer. The screener then applies the matching fundamental filters automatically and shows you a personalised shortlist of stocks worth investigating.
Investment horizon
Short, medium or long term shapes which fundamentals matter most for your strategy
Growth or value
Tell us whether you prefer fast growers, undervalued businesses, or steady dividend payers
Company phase
Early stage, scaling, or established. Each has a different financial profile and risk level
Set your own criteria and see results instantly
Prefer to filter manually? Choose your P/E range, market cap band, sector, and country. The screener applies all criteria simultaneously and updates the stock list in real time. Stack as many filters as you need to narrow 25,000 stocks to a handful of genuine candidates.
36 fundamental filters
From P/E and EV/EBITDA to free cash flow yield and dividend history
Combine as many as you need
Stack filters to narrow 25,000 stocks down to a manageable shortlist
Save your filter setup
Store your preferred criteria and rerun the screen any time with one click
The ratios that matter most, and what they actually tell you
Each ratio answers one specific question. The skill is knowing which question to ask first, and when a ratio on its own is misleading.
How to read ratios together, not in isolation
A single ratio tells you almost nothing. The real insight comes from how they relate to each other. Here are four combinations that matter.
When fundamental data can mislead you
Good investors know the limits of their tools. Here are the situations where financial ratios require extra scepticism.
Adjusted earnings versus reported earnings
Many companies report two sets of earnings figures: GAAP (the official accounting standard) and adjusted or non-GAAP. Adjusted earnings exclude items management considers exceptional, such as restructuring costs, stock-based compensation, or amortisation. The problem is that these excluded items are often real and recurring costs. A company that excludes stock-based compensation every year is not really making one-off adjustments. Always check which earnings figure you are using and what has been stripped out.
Goodwill on the balance sheet
When a company acquires another business at a premium, the excess paid above book value is recorded as goodwill on the balance sheet. Large goodwill balances inflate total assets without representing assets that could be sold or liquidated. If an acquisition underperforms, that goodwill gets written down in a future impairment charge that hits the income statement. Companies that grow aggressively through acquisitions often carry goodwill levels that deserve scrutiny before you take their book value at face value.
Sector-specific ratio norms
A bank with a debt to equity ratio of 10 is not necessarily in trouble. Banks operate with high leverage by design. A retail business with a current ratio of 0.8 might be perfectly healthy if it has strong supplier credit terms. Applying blanket ratio thresholds across sectors leads to wrong conclusions. The frameworks in this guide are useful starting points, but they should always be calibrated to the specific sector and business model you are analysing.
Historical data does not predict the future
Fundamental analysis is inherently backward looking. You are reading data that describes what the company did, not what it will do. A business with five years of excellent fundamentals can still face disruption, new competition, or demand shifts that the financial statements do not yet reflect. This is why strong investors pair historical ratio analysis with a qualitative assessment of the company's competitive position and the industry dynamics it operates in.
Stop guessing. Start analysing.
Filter 25,000 stocks by the fundamentals that match your strategy. Free to start, no credit card needed.
✓ No credit card required · ✓ Instant access · ✓ Free basic features
Why investors use Belegget for fundamental analysis
How to do fundamental analysis in practice: 5 steps
From a universe of thousands of stocks to a well-researched shortlist of candidates worth your time
Step 1: Screen broadly to eliminate the obvious mismatches
Start with a wide filter to cut the universe down. Set a P/E ceiling to exclude clearly overpriced stocks. Add a minimum revenue growth rate to ensure the business is not stagnating. Filter by debt to equity to remove highly leveraged companies from consideration. This first pass takes five minutes and cuts 25,000 stocks to a few hundred without requiring deep research. You are not looking for the perfect stock here. You are looking for the stocks worth investigating.
Step 2: Identify companies with sustainable growth, not just fast growth
Revenue growth in isolation is easy to engineer through acquisitions, price cuts, or one-off contracts. Sustainable growth shows up differently. Gross margin holds steady or expands as the business scales. Organic revenue growth (excluding acquired revenues) remains consistent. The customer base broadens rather than depending on a small number of large accounts. When you filter for revenue growth, always open the gross margin trend alongside it. A company growing at 20 percent while margins are contracting is not in the same position as one growing at 20 percent while margins are expanding.
Step 3: Stress-test the balance sheet before you go further
A compelling income statement can hide an uncomfortable balance sheet. Before spending serious time on a company, check its debt to equity ratio, current ratio, and interest coverage. The question is not whether the business is profitable today, it is whether it can survive a year where conditions get worse. Companies with net cash positions and low debt can absorb setbacks. Companies with high debt and thin interest coverage cannot. This filter alone eliminates a large portion of candidates that look attractive at the earnings level but carry meaningful financial risk underneath.
Step 4: Compare valuation to history and peers, not to an abstract number
Once you have a shortlist of financially healthy, growing businesses, the question becomes price. A P/E of 18 for a consumer staples company might be expensive. The same P/E for a software company with 25 percent revenue growth and expanding margins might be cheap. Valuation ratios only carry meaning in context. Compare the company to its own five-year historical average and to the sector median. A business trading below both of those levels with unchanged or improving fundamentals is the definition of what fundamental analysis is designed to surface.
Step 5: Build a watchlist and track how fundamentals evolve over time
The best investment ideas are rarely urgent. A company you identified as high quality but too expensive today may trade at a much more attractive level in six months after a sector pullback or a disappointing quarter. Saving filtered lists and individual stocks to your watchlist means you can revisit candidates quickly when conditions change. More importantly, tracking fundamentals over time tells you whether your original thesis is holding. If revenue growth is slowing and margins are compressing quarter after quarter, the thesis is weakening even if the share price has not reacted yet.
Which type of investor uses stock fundamental analysis?
The framework is the same. What you filter for depends on your goal.
Ready to run your first screen?
Set your filters, find your stocks, and start building a portfolio grounded in real fundamentals.
Common questions about fundamental analysis
More ways to find undervalued stocks
Fundamental analysis is the foundation. These guides take you further into finding stocks that trade below what they are actually worth.
Value Stock Screener
How to set up a screener specifically for value stocks. Which filters matter, which thresholds to use, and how to avoid the classic value traps that trap even experienced investors.
Undervalued Stock Screener
A practical guide to finding stocks that trade below their fair value right now. Includes the specific filter combinations used by experienced value investors.
Intrinsic Value Stock Screener
How to estimate what a company is actually worth and use that number to screen for stocks with real upside relative to their intrinsic value.